Case study · ERP dashboard and agent
ERP Dashboard + AI Purchasing Agent:One Live View of the Business
See the whole business
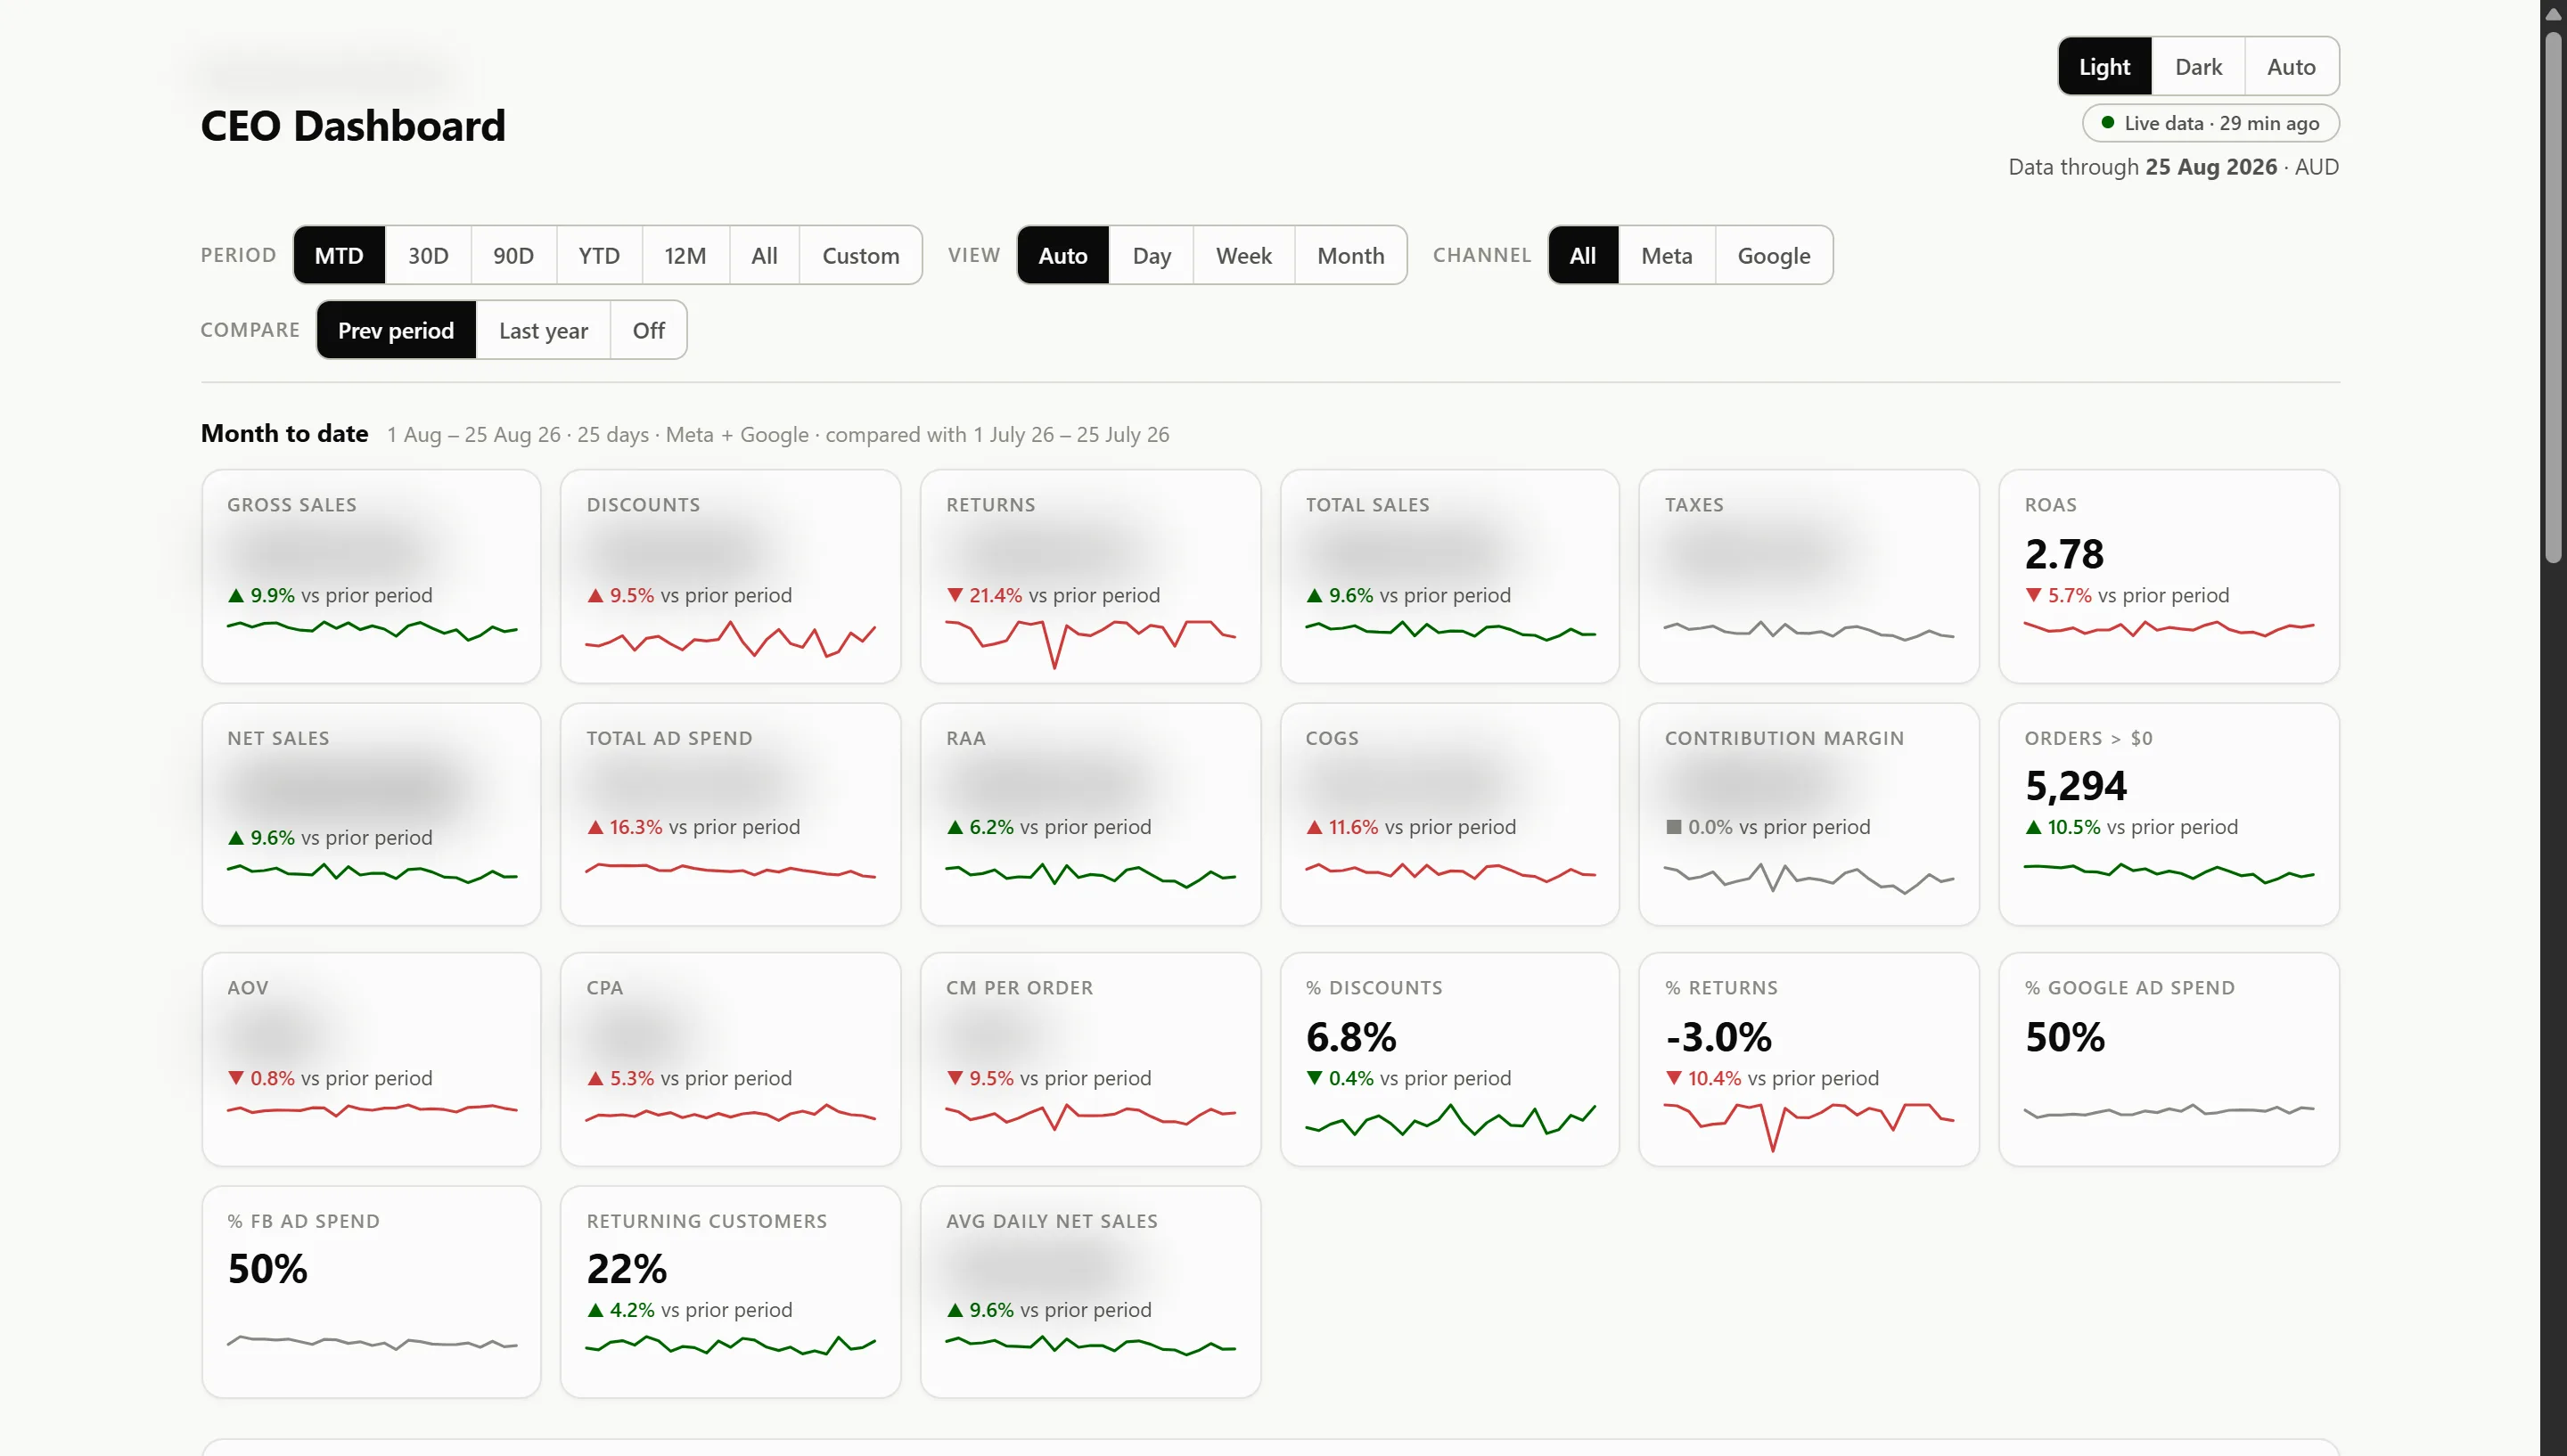
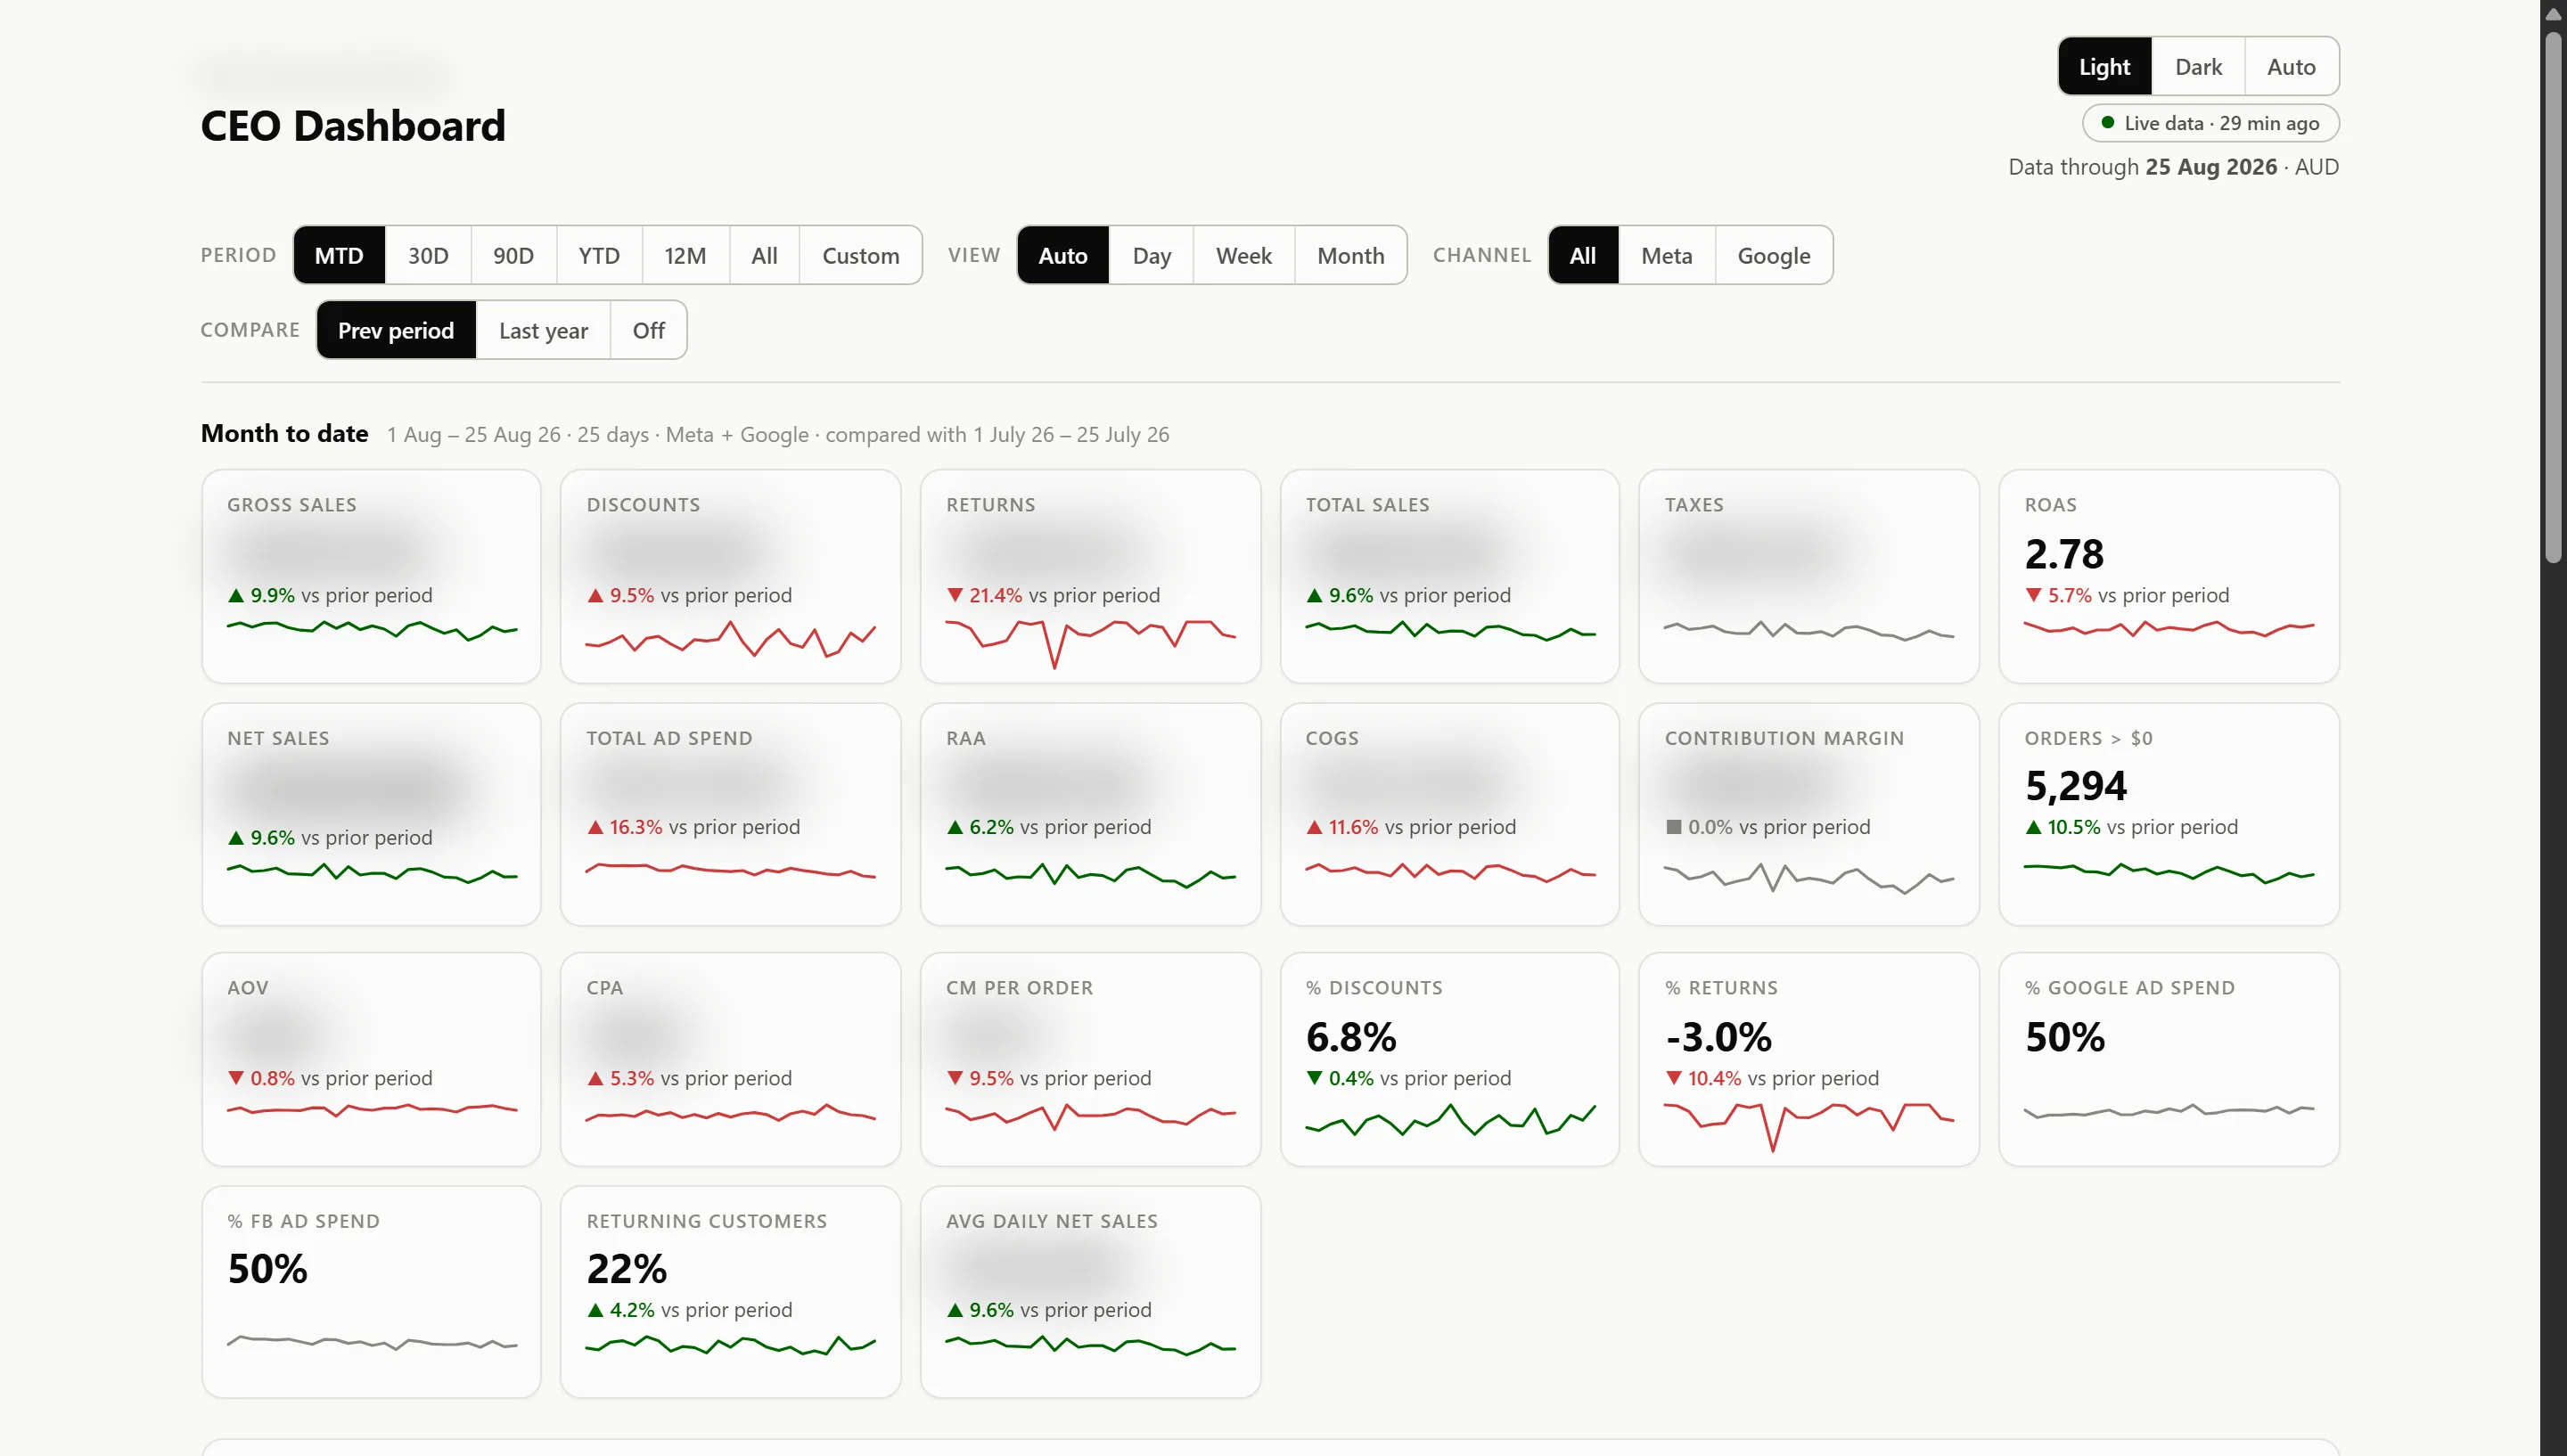
The month at a glance.
1 / 6
We built an ERP dashboard for an Australian mobile phone parts wholesaler: one live view of sales, customers, products and the real P&L, and a purchasing agent that suggests what to order.
- 70,969monthly sales rows matched to the ERP
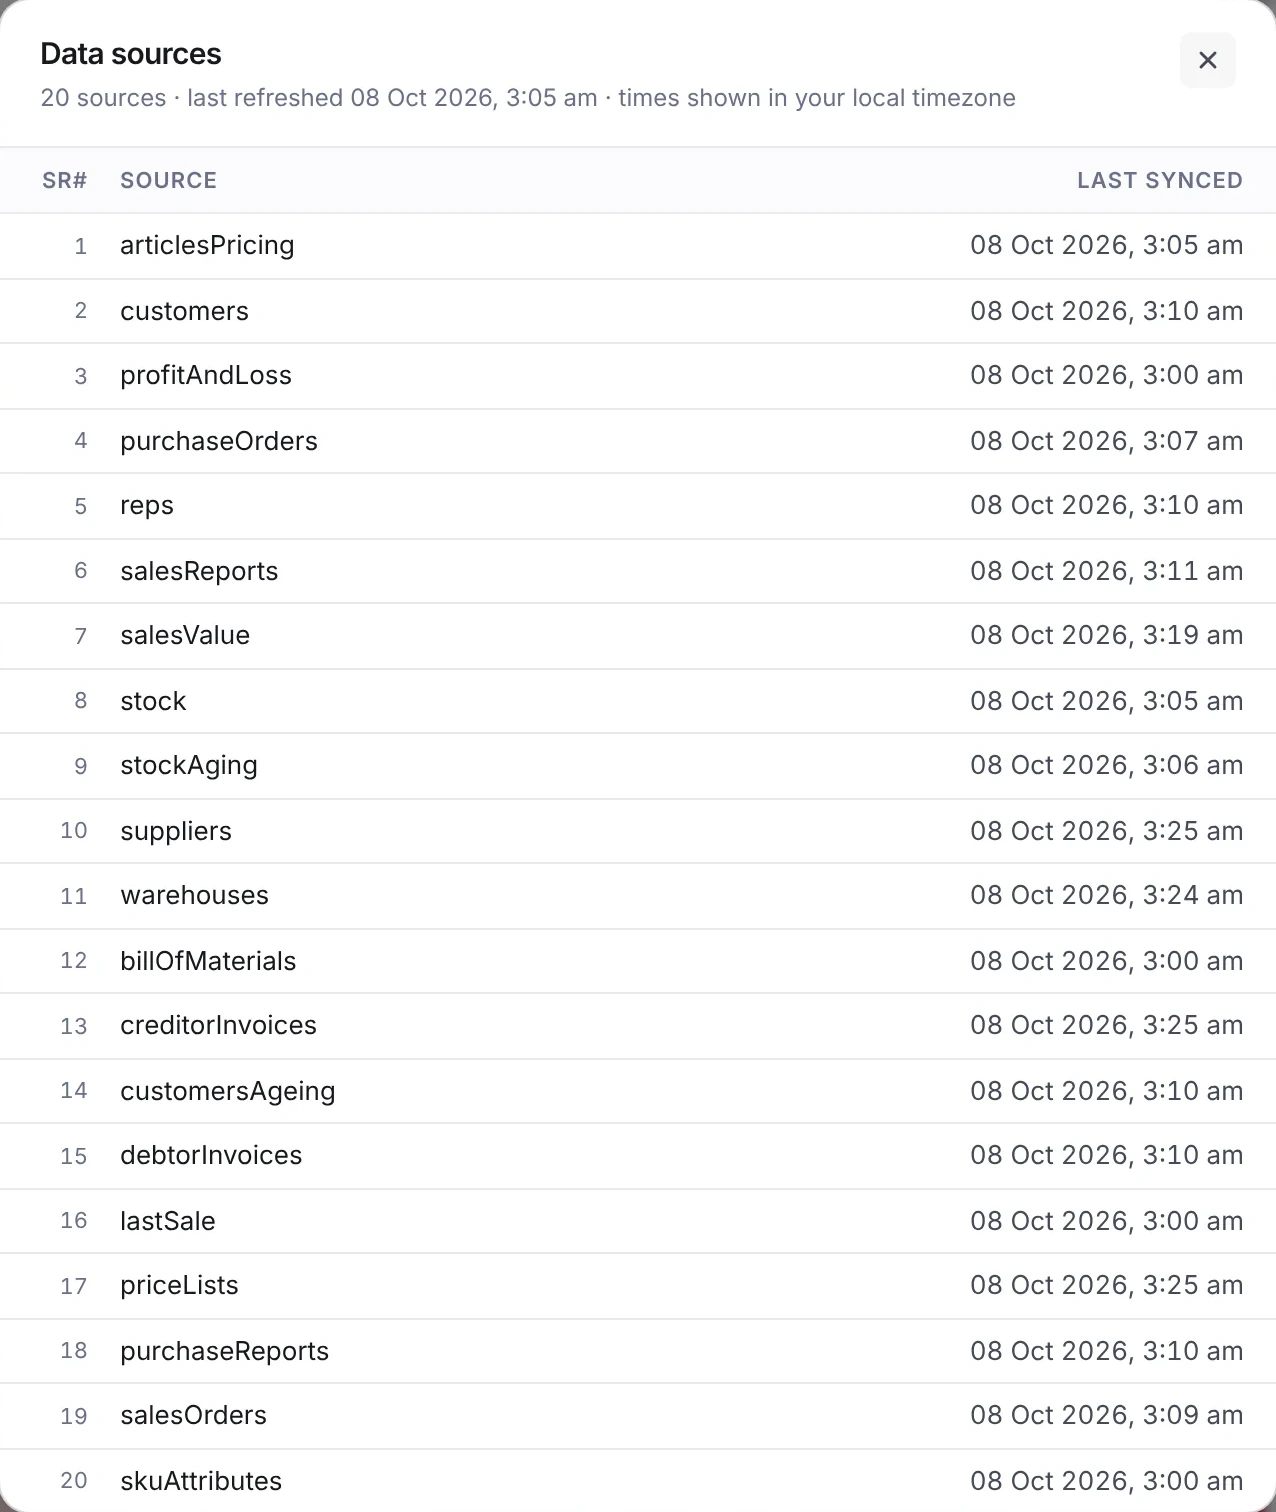
- 20ERP feeds, refreshed hourly
See the whole business
The month at a glance.
1 / 6
01The problem
The ERP had the data. Not the answers.
- Every answer started as an export.
- Buying meant five reports and two layers of Excel, every week.
- Nothing checked the sheets against the ERP, so a wrong total looked as good as a right one.
- rows in one sales report
- 38,434
02Trusted data
We connected every ERP feed, then checked every row.
We brought 20 ERP feeds into one model that refreshes every hour. Then we compared every row with the ERP's own reports.
- customer, SKU and month rows. None missing, none extra.
- 70,969
- ledger values, matched to the cent.
- 1,614
03What we built
We built two tools on one set of numbers.
The dashboard and the buying plan read the same model.
- The ERP dashboard
- Company, customers, products and the real P&L.
- The purchasing agent
- Suggested quantities the team reviews, then exports.
A
B
04What the team sees
Now the team can answer nine questions in one place.
1/9Company overview
Are we on target this month?
This month against its target, and where it lands at today's pace.
2/9Customer detail
Which customers are falling behind?
Every customer against its own target, with its trend and its pace. One filter shows only the ones at risk.
3/9Rep performance
How is each rep tracking?
Each rep against target, with how many of their customers are over, on track or at risk.
4/9Customer health
Which accounts need a call?
Accounts likely to leave, ranked by value at risk. Each one comes with a next step.
5/9Products
What actually sells?
Units and revenue by category and series, month by month.
6/9Financial highlights
What did the period actually make?
Revenue, cost of sales, margins and expenses for any period.
7/9P&L statement
Which ledger lines made that number?
The P&L, line by line, straight from the ledger.
8/9Ratio analysis
Are the margins holding?
Gross, operating and net margin, the cost ratios and growth, month by month, from the posted P&L. The month in progress shows what has posted so far.
9/9Debtors
Who owes us, and how late is it?
Every open invoice, aged from current to over 90 days. What is overdue and the oldest debt sit up front. Related-party balances are kept out of the total.
05The purchasing agent
The agent turns stock and sales into a buy list.
It reads stock, open orders and sales for every SKU, applies the team's buying rules and suggests what to order.
- A quantity for every SKU, or the reason there isn't one.
- Anything it can't work out goes to a person.
- The reviewed list exports as a file.
06The buying rules
When a rule changes, so does the quantity.
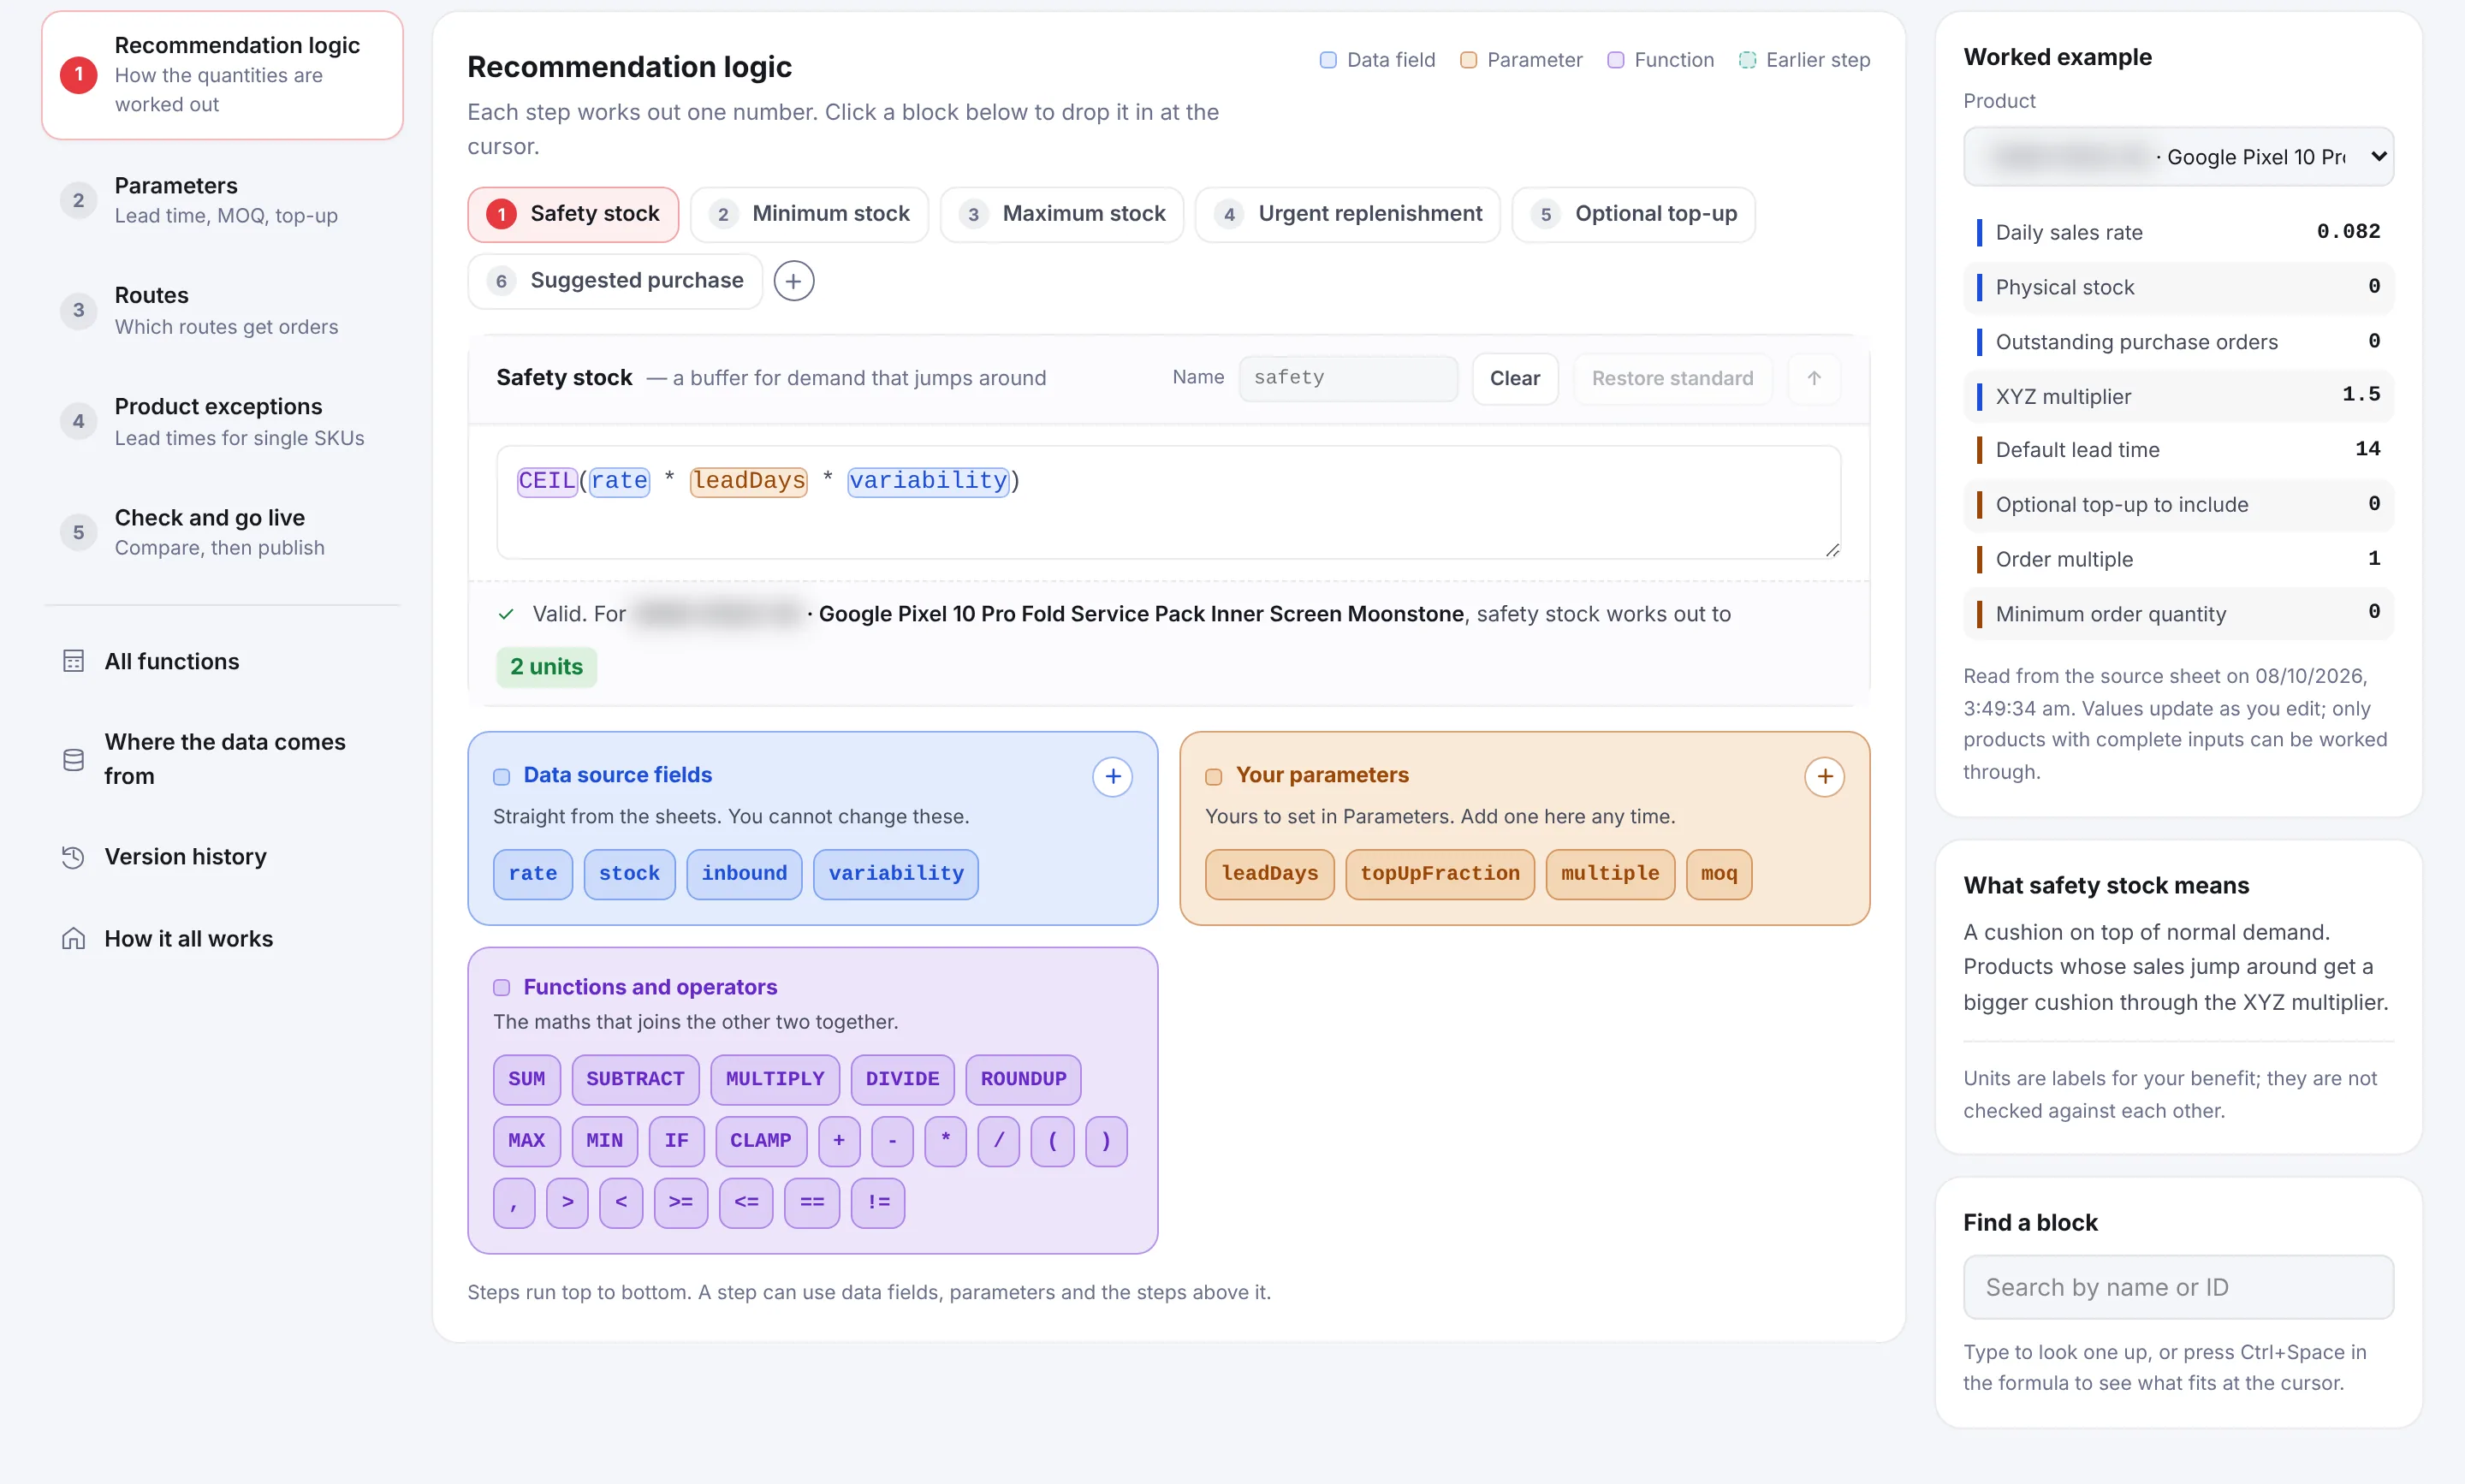
The buying team writes the rules with spreadsheet functions like IF, MIN, MAX and ROUNDUP. They preview what changes, then make it live.
Safety stock, the standard rule
CEIL(rate × leadDays × variability)
- Daily sales rate
- 0.082
- Lead time, days
- 14
- Variability (XYZ)
- 1.5
0.082 × 14 × 1.5 = 1.72
2 units
safety stock for this product
07What changed
What the team can do now.
- 01
Read the whole business on one screen
Sales, targets, customers, products and the P&L come from one model. Nobody rebuilds a report to ask a new question.
- 02
Trust the number in the room
Every row ties back to the ERP. A meeting starts with the answer, not with whose spreadsheet is right.
- 03
See risk before it costs a month
Accounts slipping, lapsing or behind pace are ranked by value at risk, each with a next step.
- 04
Read the month from the real ledger
Margins and cost ratios come from posted accounts. The month in progress shows what has posted so far, or a projection.
Related resources
Want one view across your business?
We build on the ERP you already run, and check every number against it.