The Intelligence Library

Operational intelligence from real client delivery

Every resource here is extracted from systems we actually shipped — implementations, workflows and measured outcomes, not generic AI content. Free to read, built to be used.
All resources

25

Blueprint

Marketing

Meta Ads Performance Dashboard Blueprint
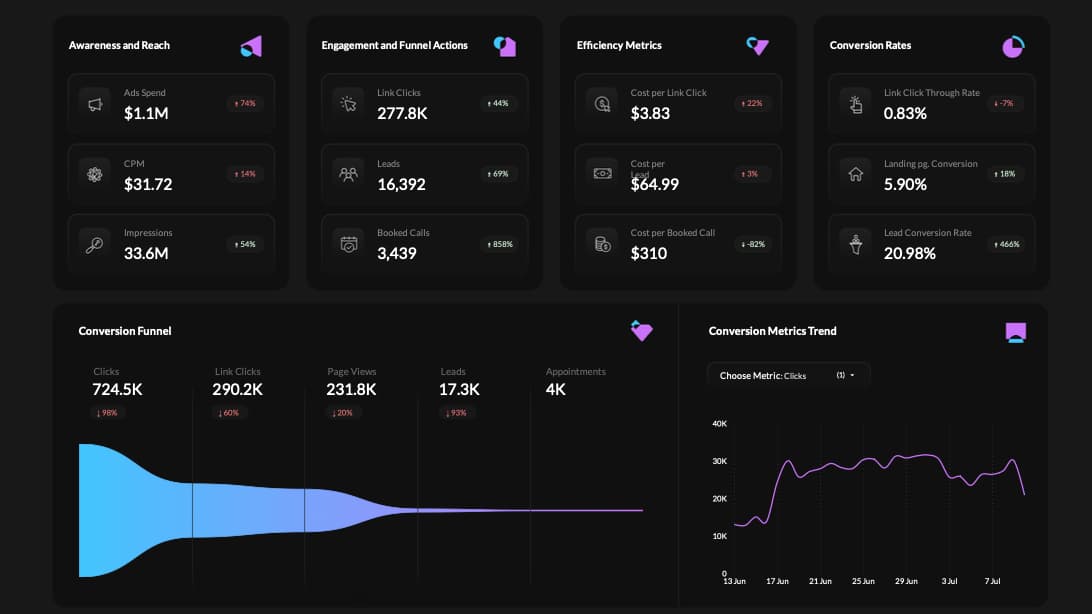
See the Meta Ads dashboard that turns spend, creative and funnel data into one operating view. Enter your email and we will send you the full blueprint.

The Meta Ads dashboard: four groups of tiles for awareness, engagement, efficiency and conversion, then the conversion funnel from clicks to appointments beside the conversion metrics trend.
FreePDF
PDF · 11 pages

2026-10-11

Get the free blueprint
Case Study

Operations

Client Operations Command Centre
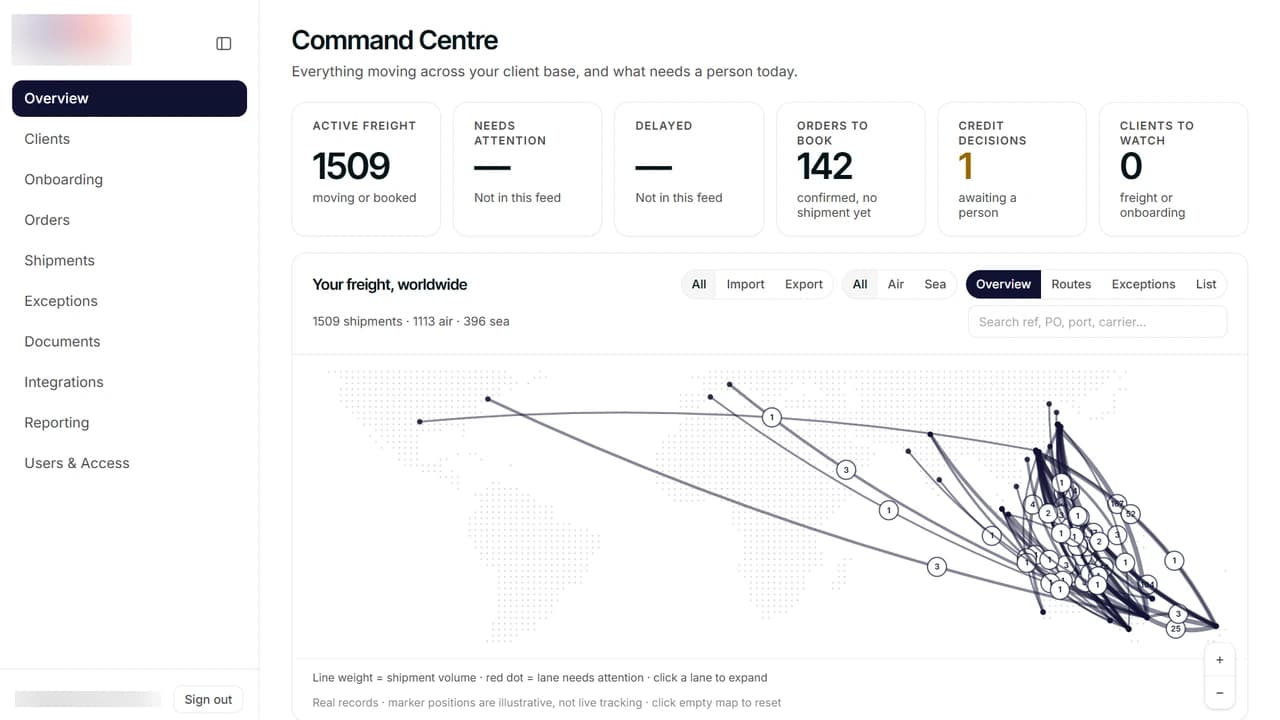
We replaced paper credit applications and scattered client admin with one Command Centre. Online onboarding, e-signature, staff access and scheduled client reports, as the first wins of a bigger move.

The Command Centre overview. Cards read 1509 active freight, 142 orders to book and 1 credit decision awaiting a person, above Your freight, worldwide drawn as lanes on a world map, with the full navigation down the left.
9steps in the online credit application10Command Centre sections, granted per person
Client operations portal

2026-10-10

Read the case study
Case Study

Reporting & Dashboards

ERP Dashboard & Purchasing Agent
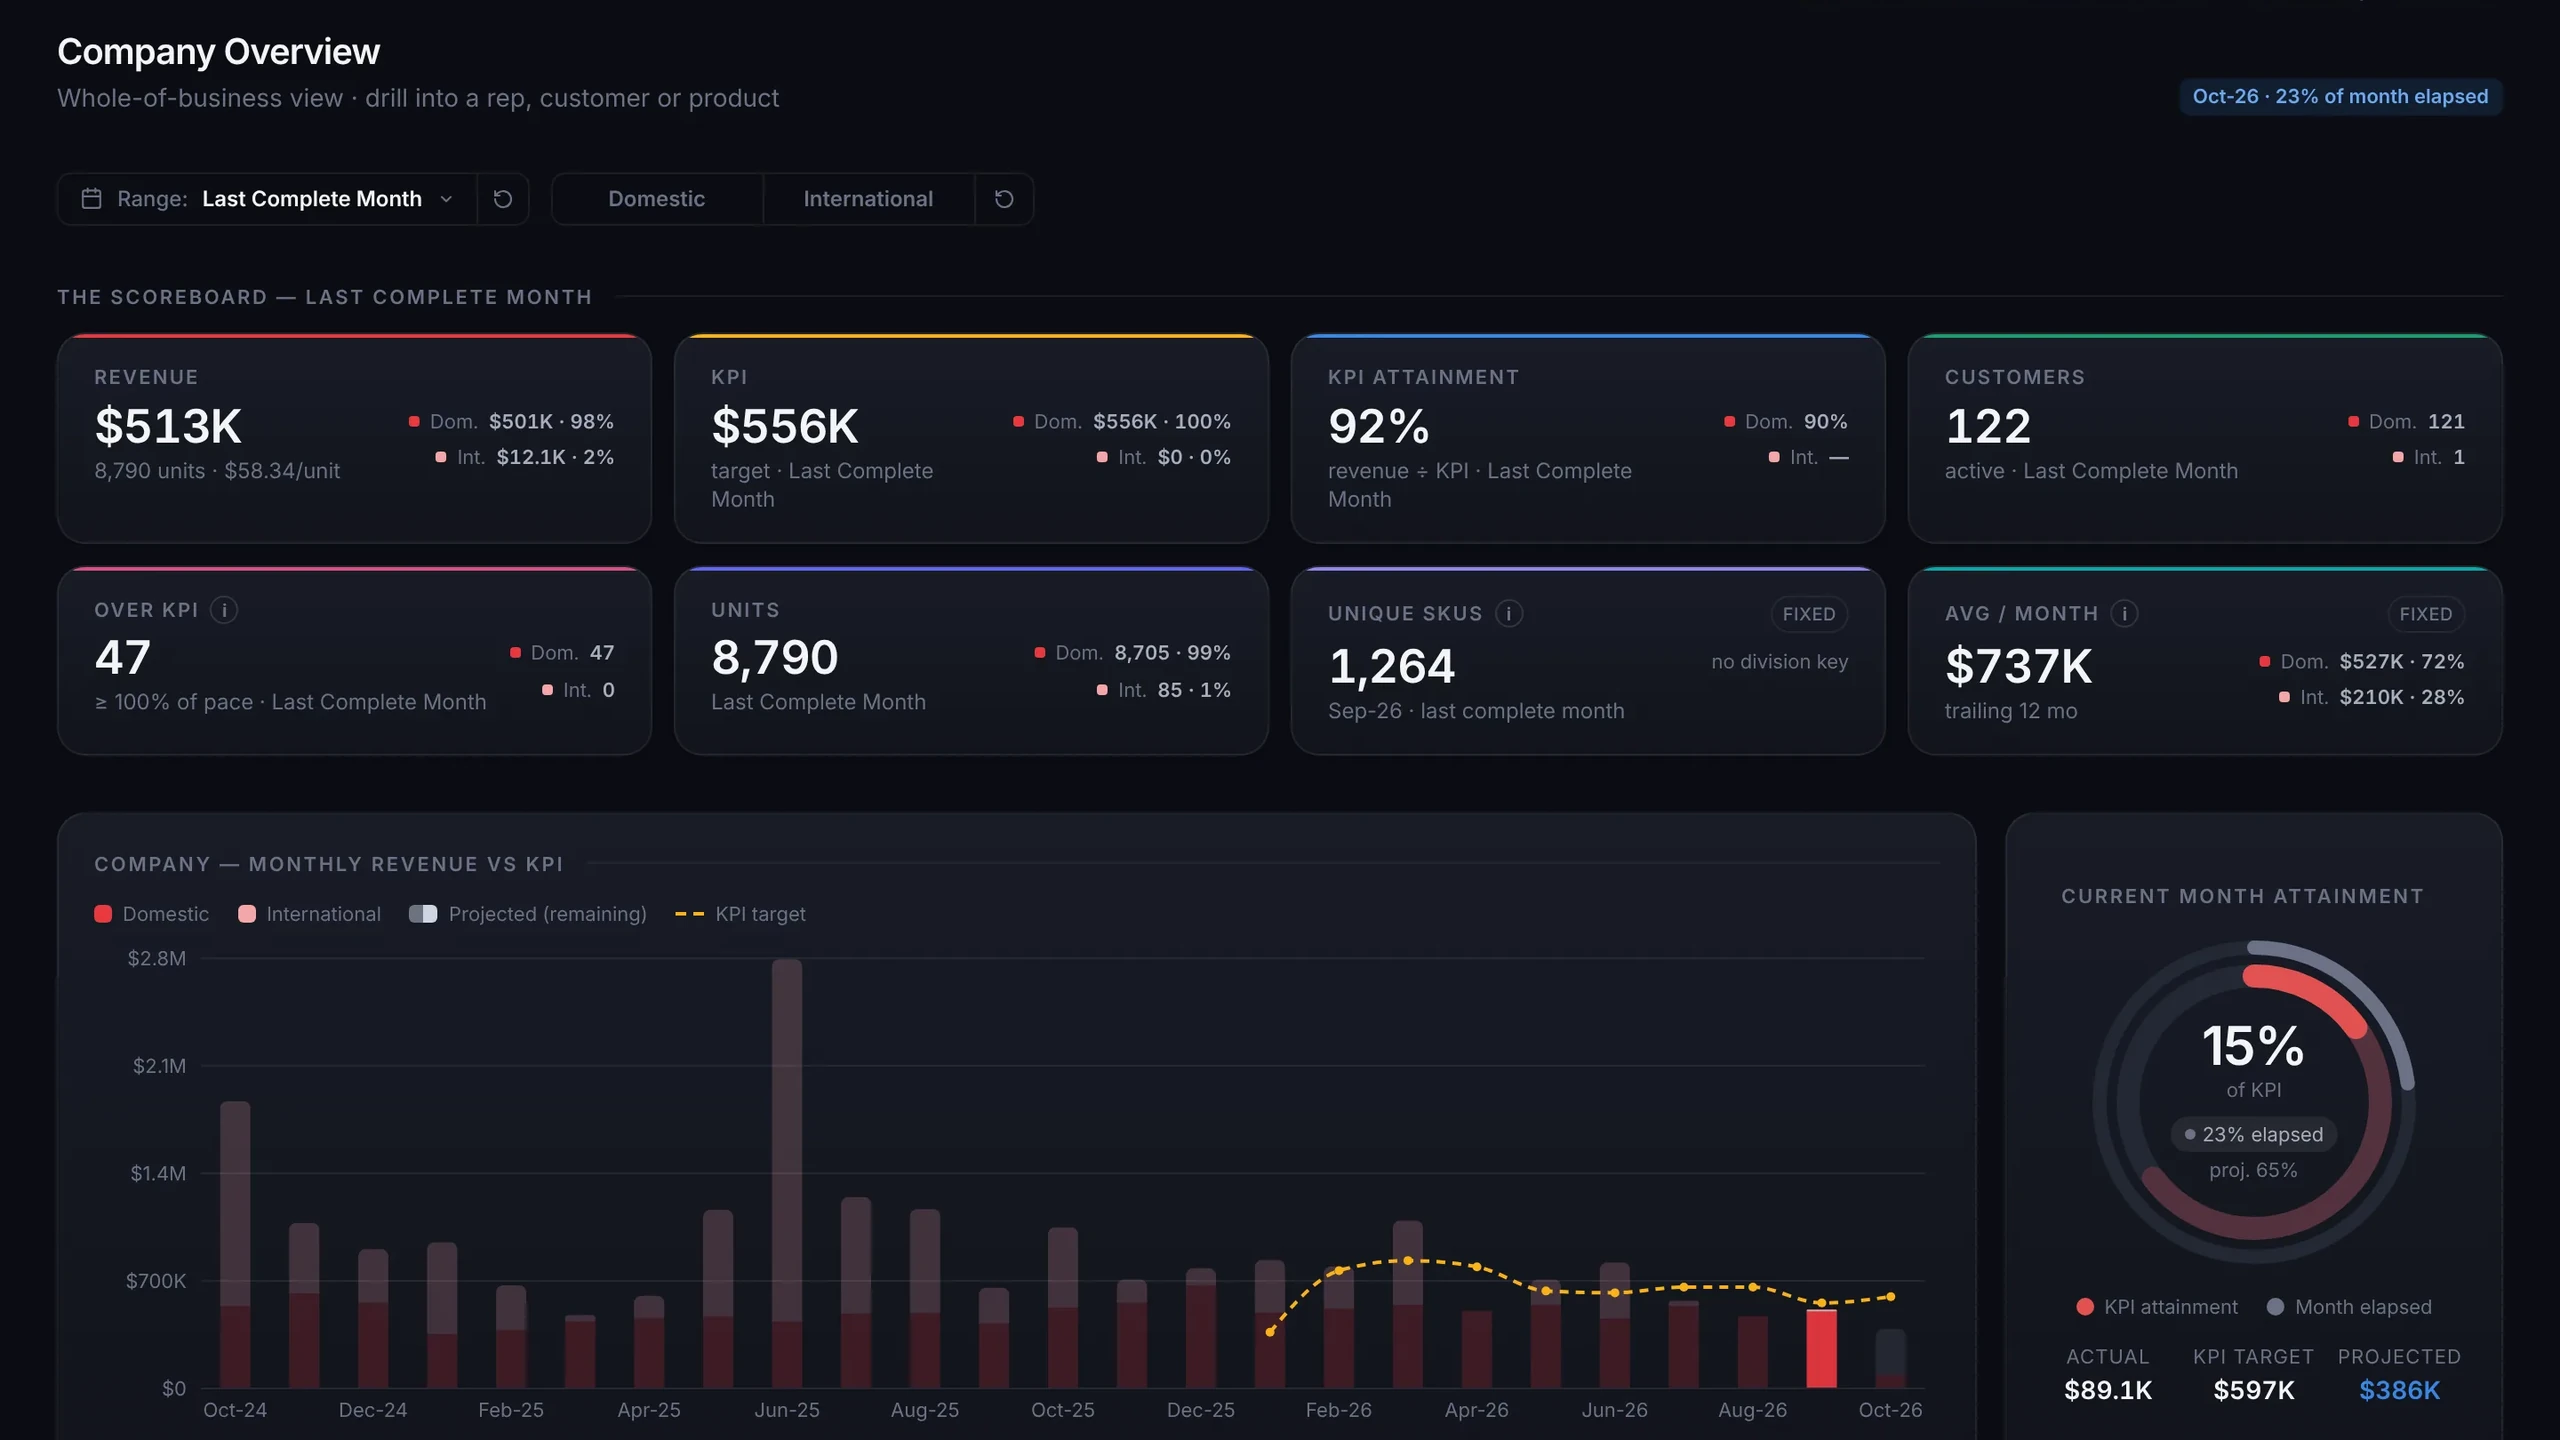
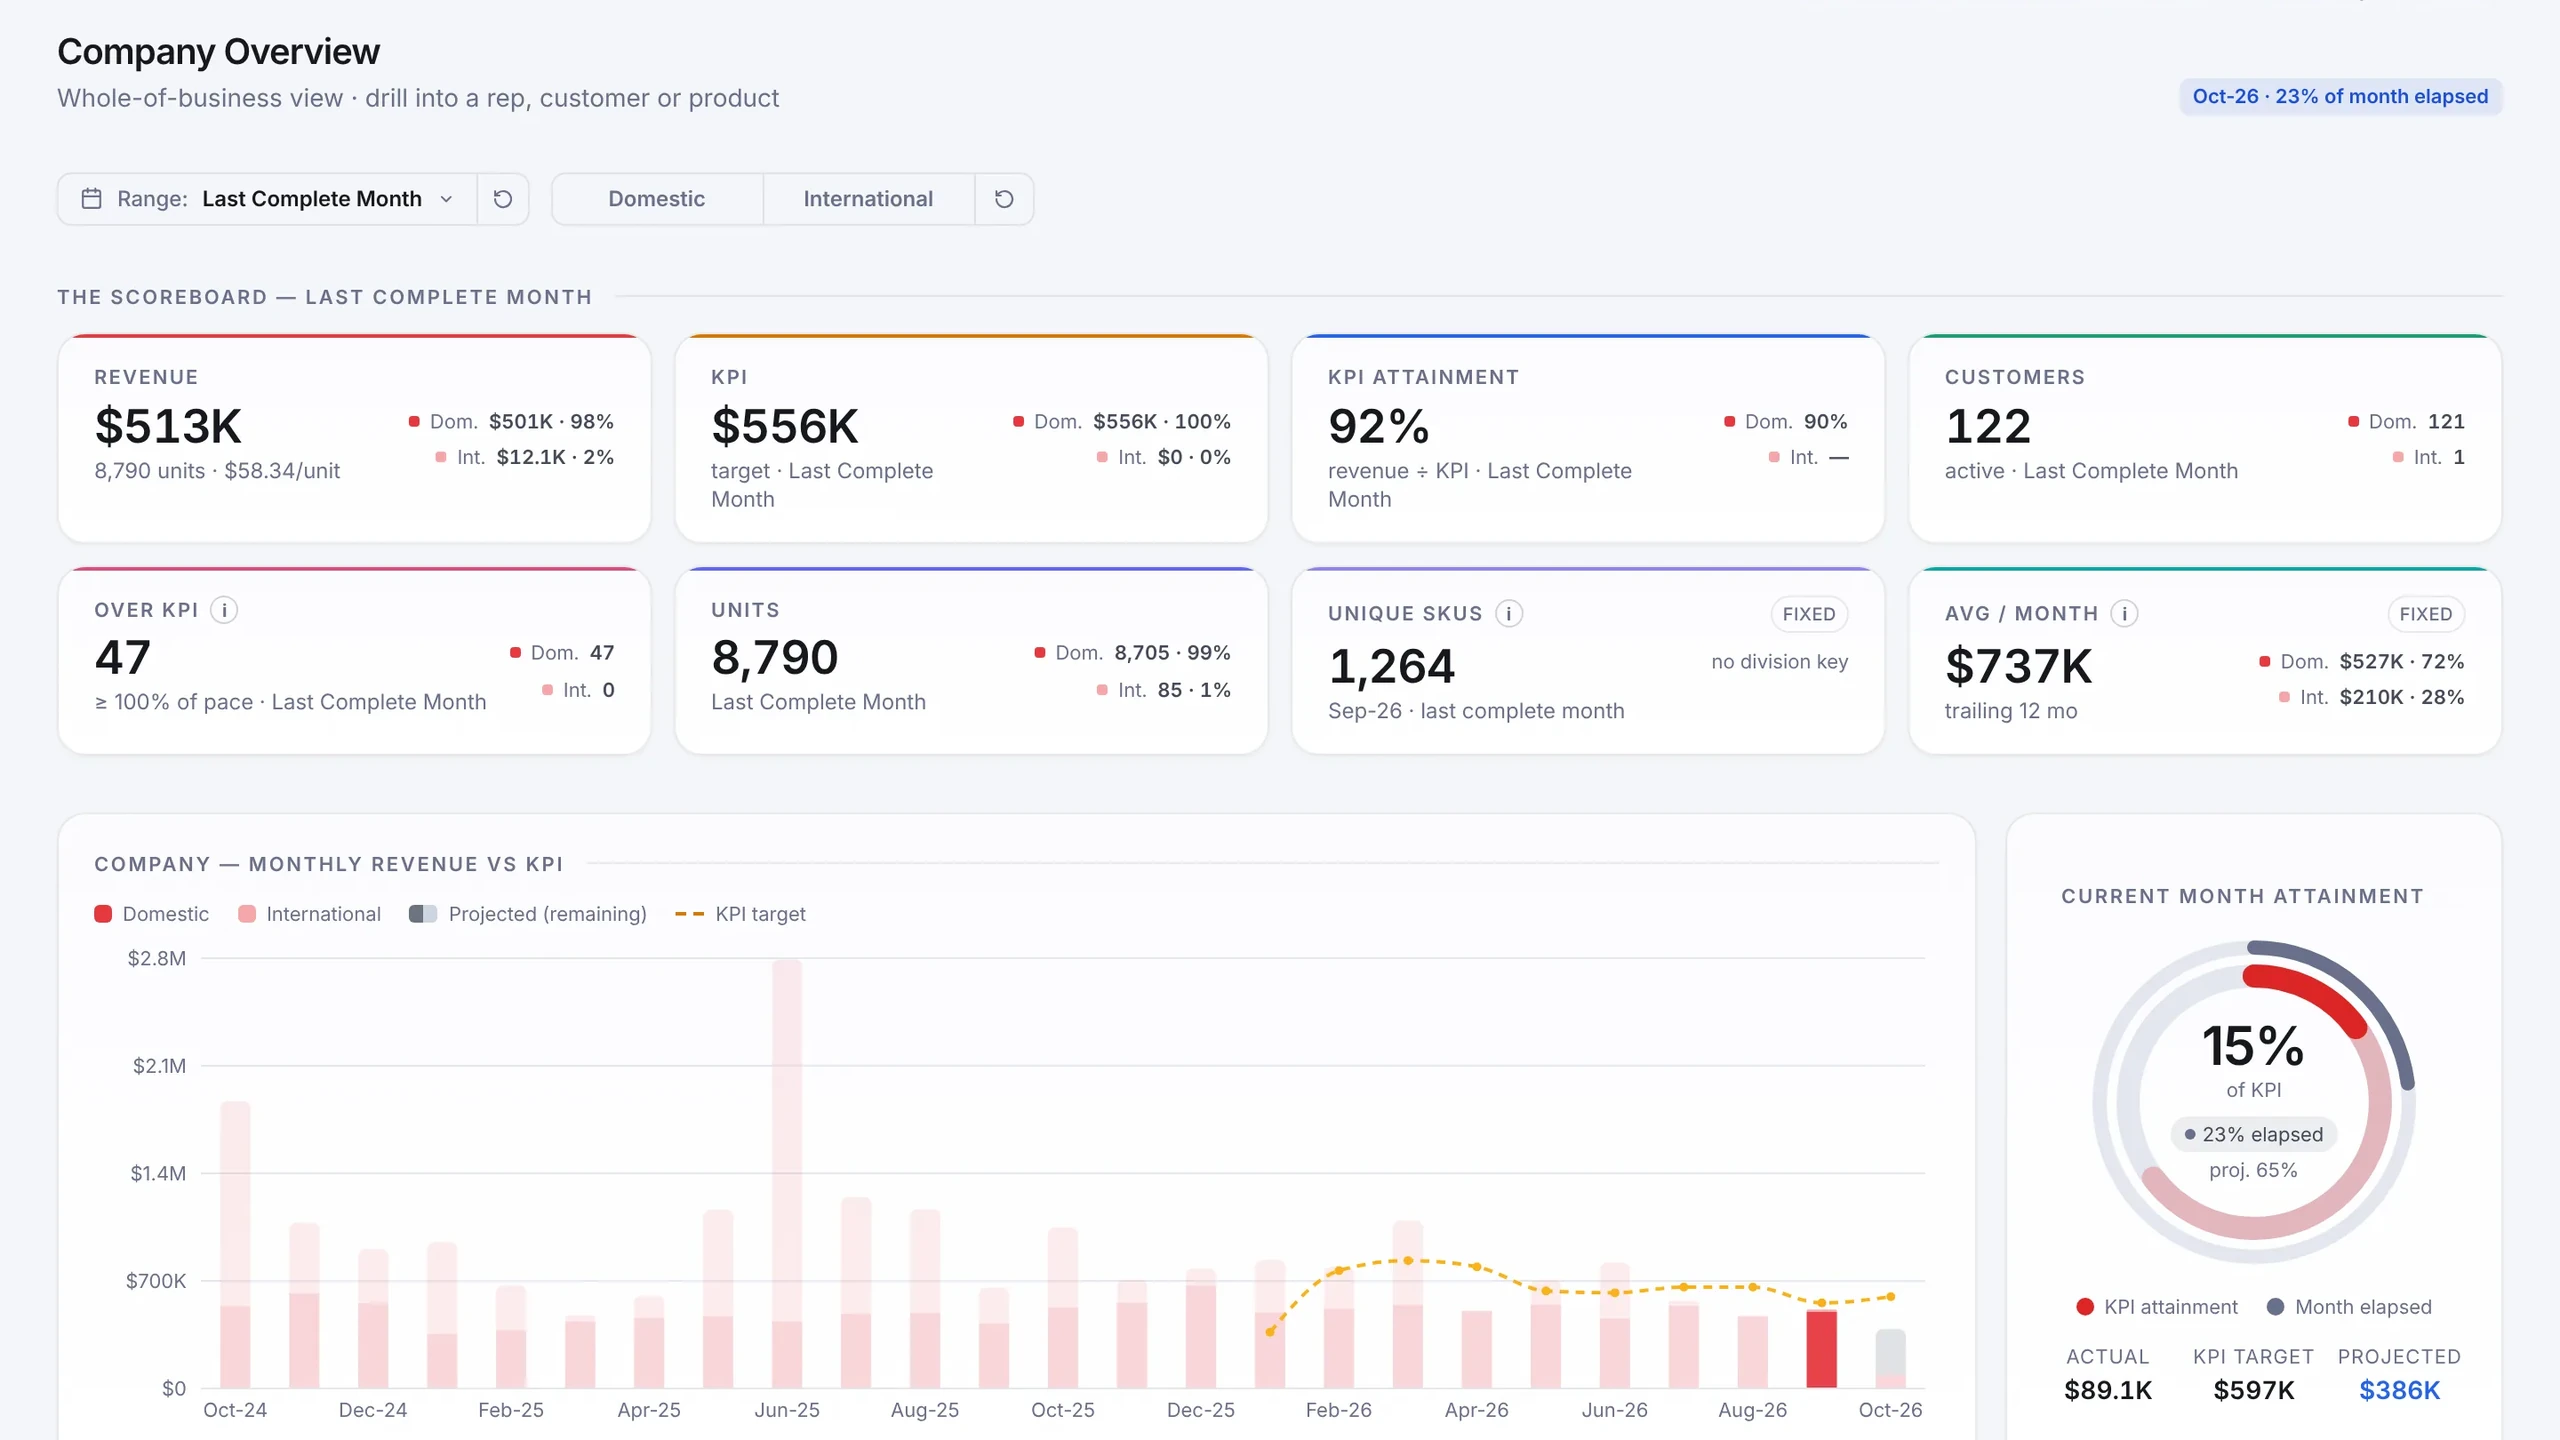
We turned a wholesaler's ERP exports into one live view across sales, customers, products and the real P&L. Then we built a purchasing agent on the same numbers.

The company overview. The scoreboard reads $513K revenue against a $556K target, 92% attainment and 122 active customers, above the monthly revenue against target and the current month's attainment ring.
70,969monthly sales rows matched to the ERP103ledger accounts in the live P&L
ERP dashboard

2026-10-08

Read the case study
Blueprint

Marketing

Paid Media + Creative Performance Dashboard
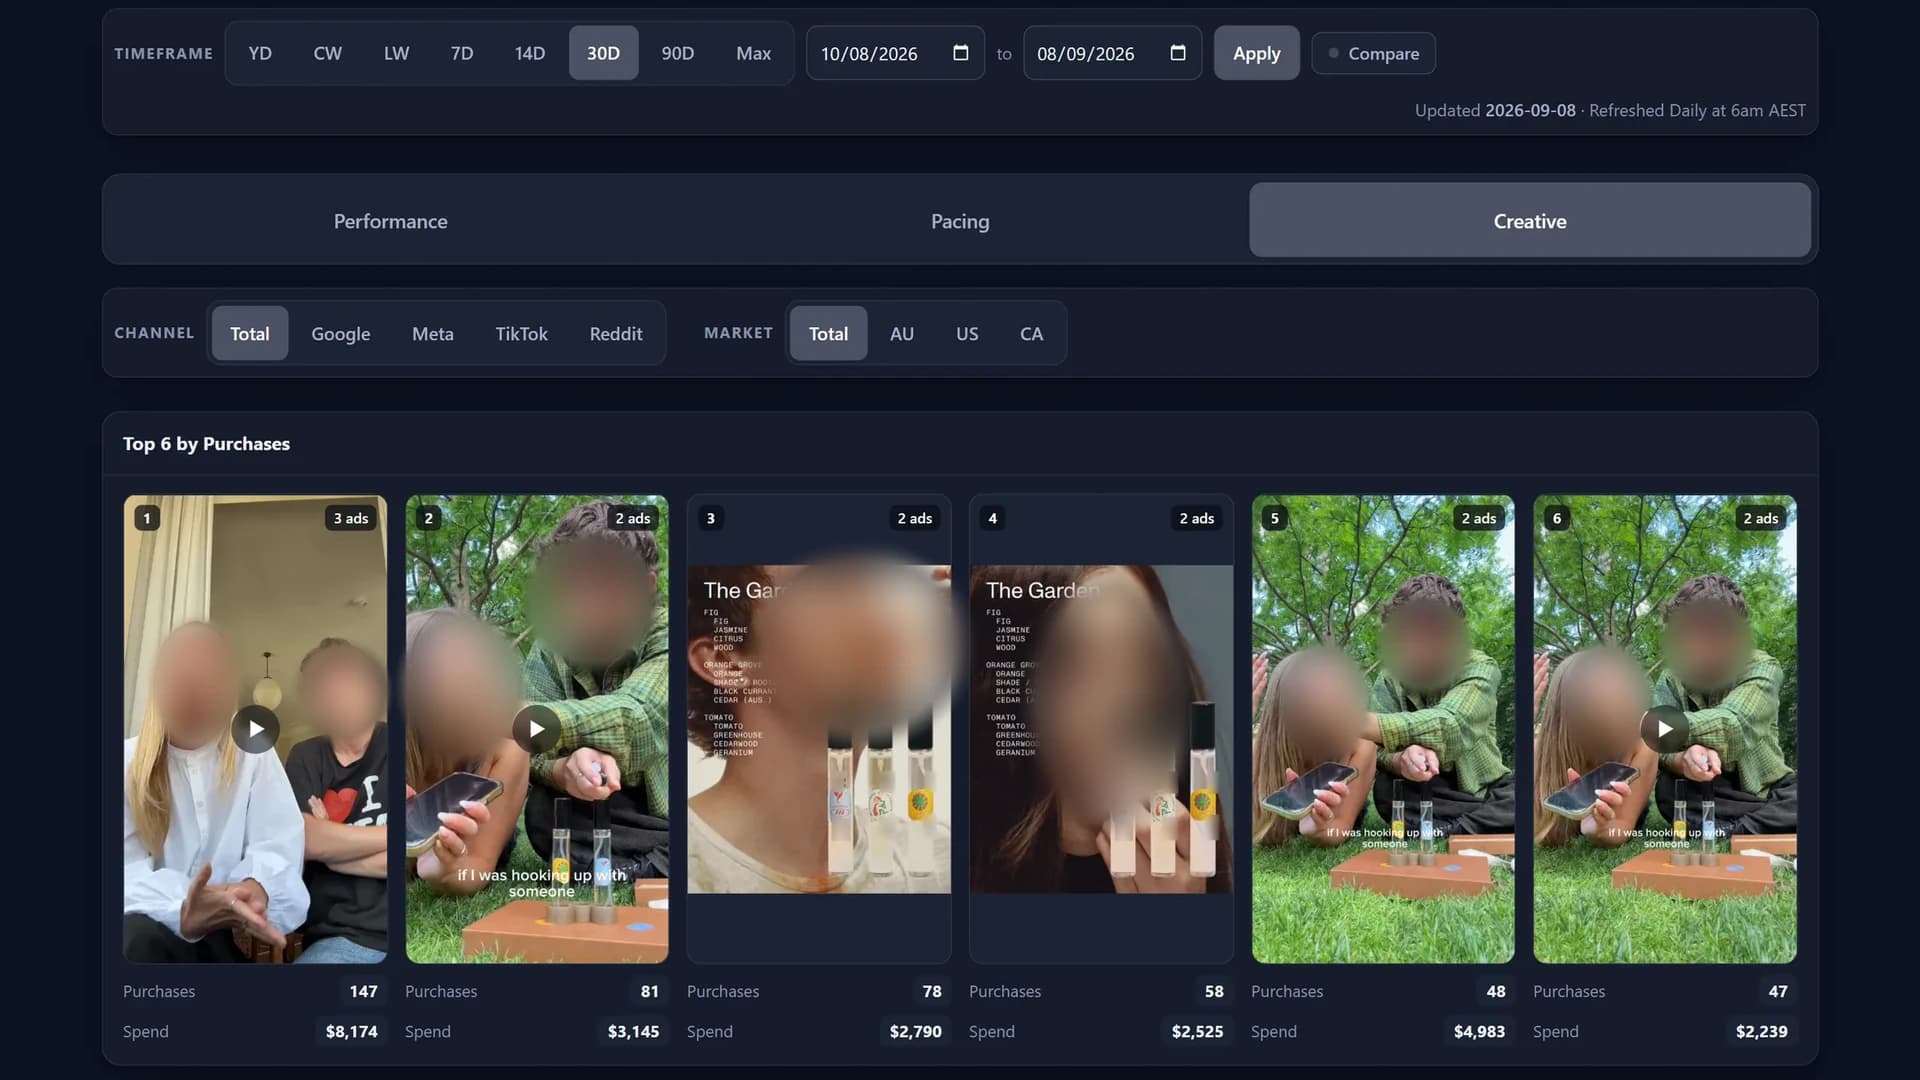
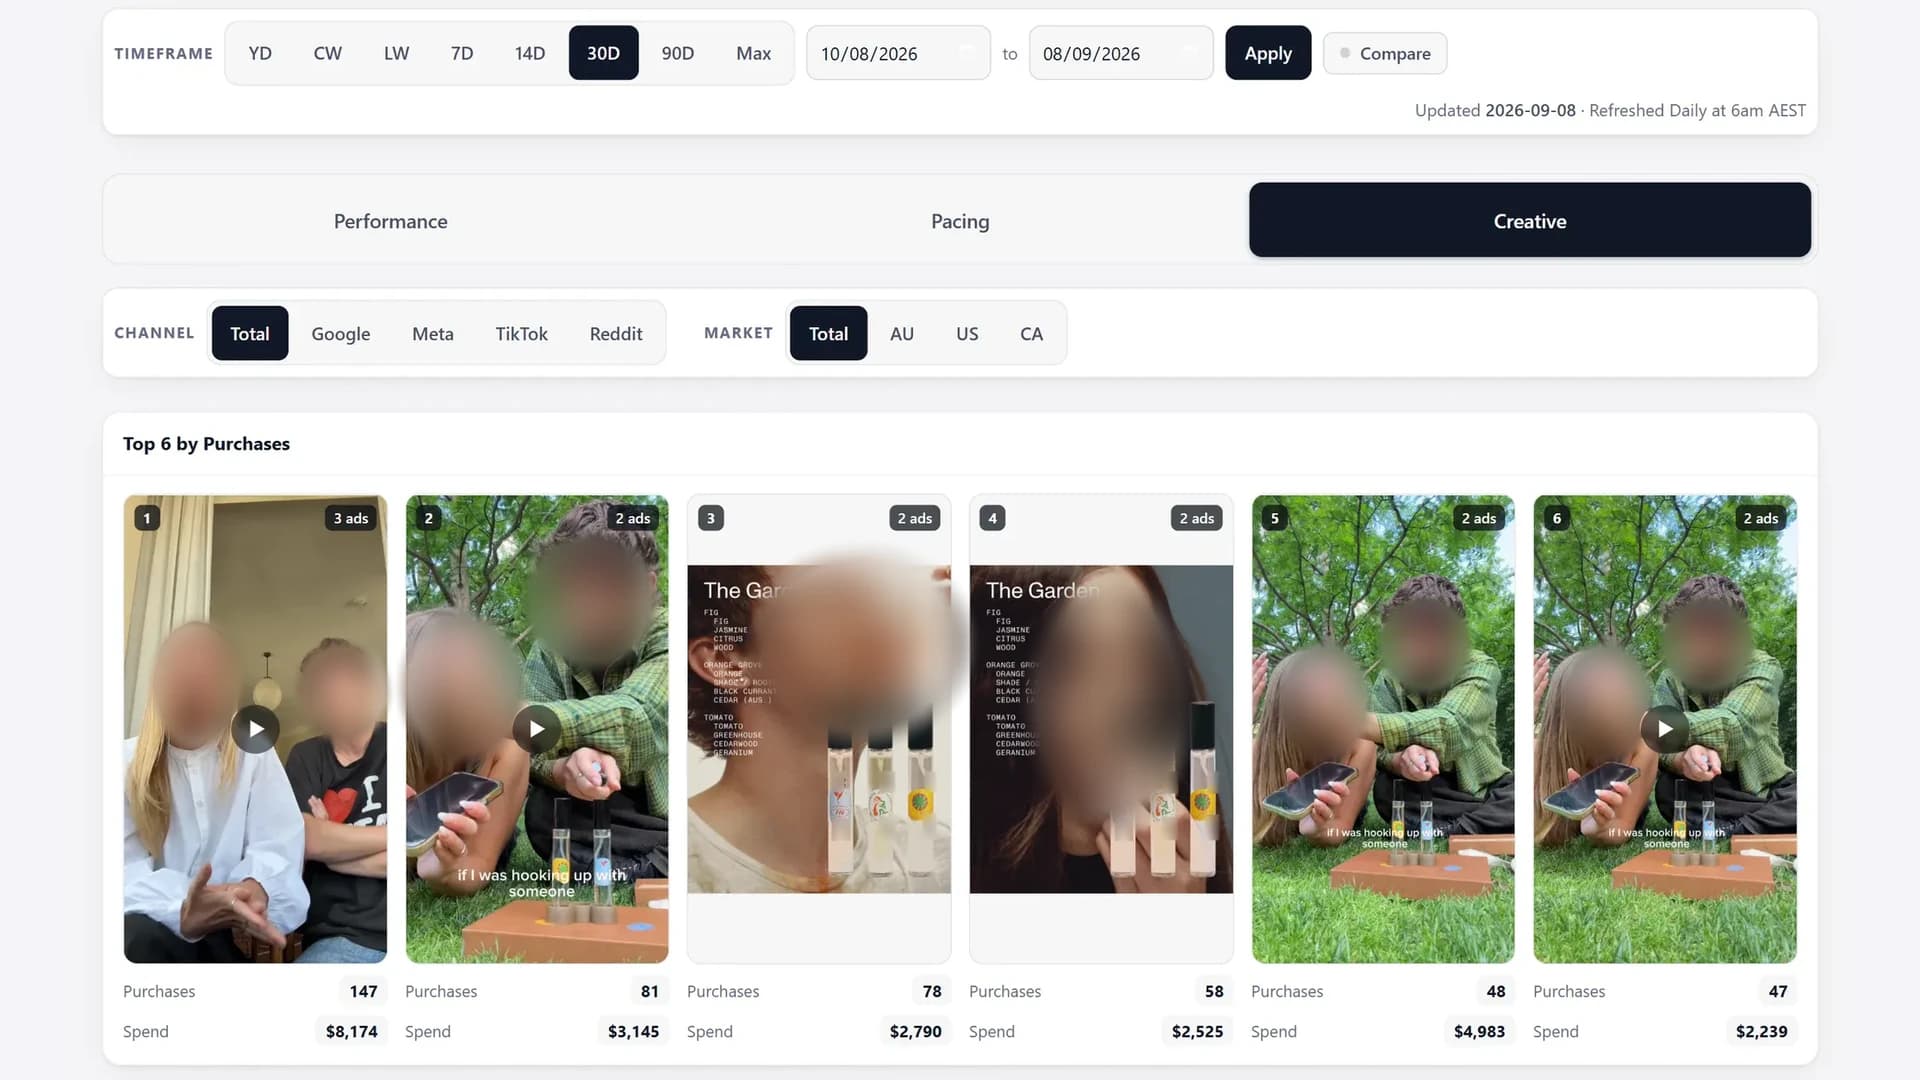
We built a dashboard that puts every creative next to its purchases, spend and return. Enter your email and we will send you the full breakdown.

The Creative view of the Paid Media and Creative Performance Dashboard: timeframe presets, the Performance, Pacing and Creative tabs with Creative selected, channel and market filters, and the Top 6 by Purchases board, six ad stills each with its purchases and spend.
FreePDF
PDF · 11 pages

2026-09-27

Get the free blueprint
Case Study

Marketing

Competitor Ads Intelligence
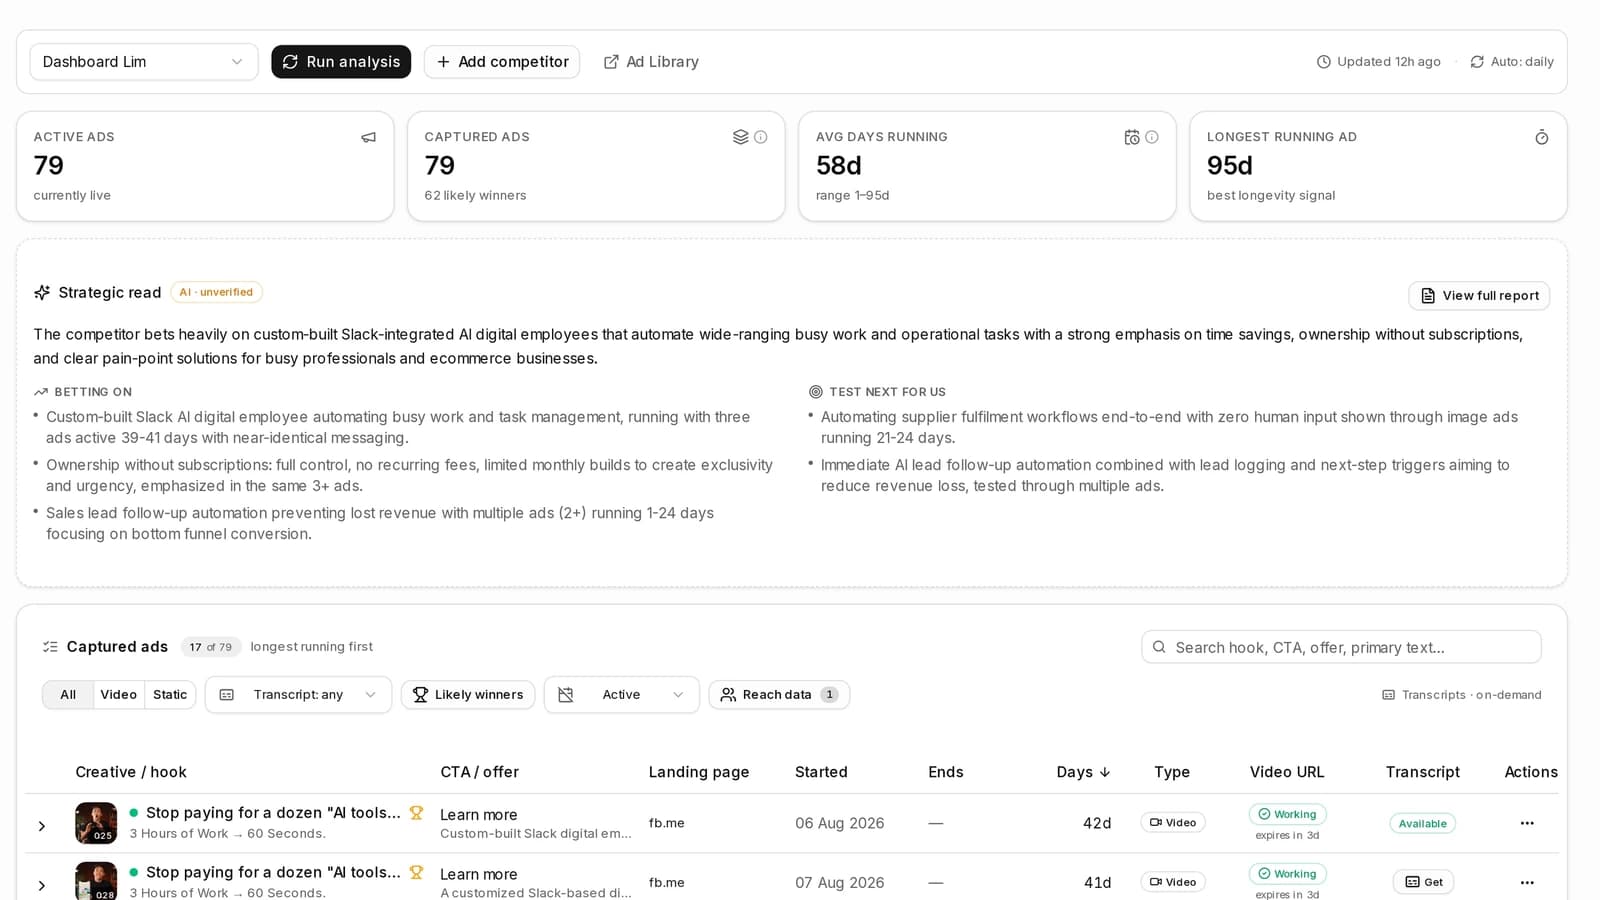
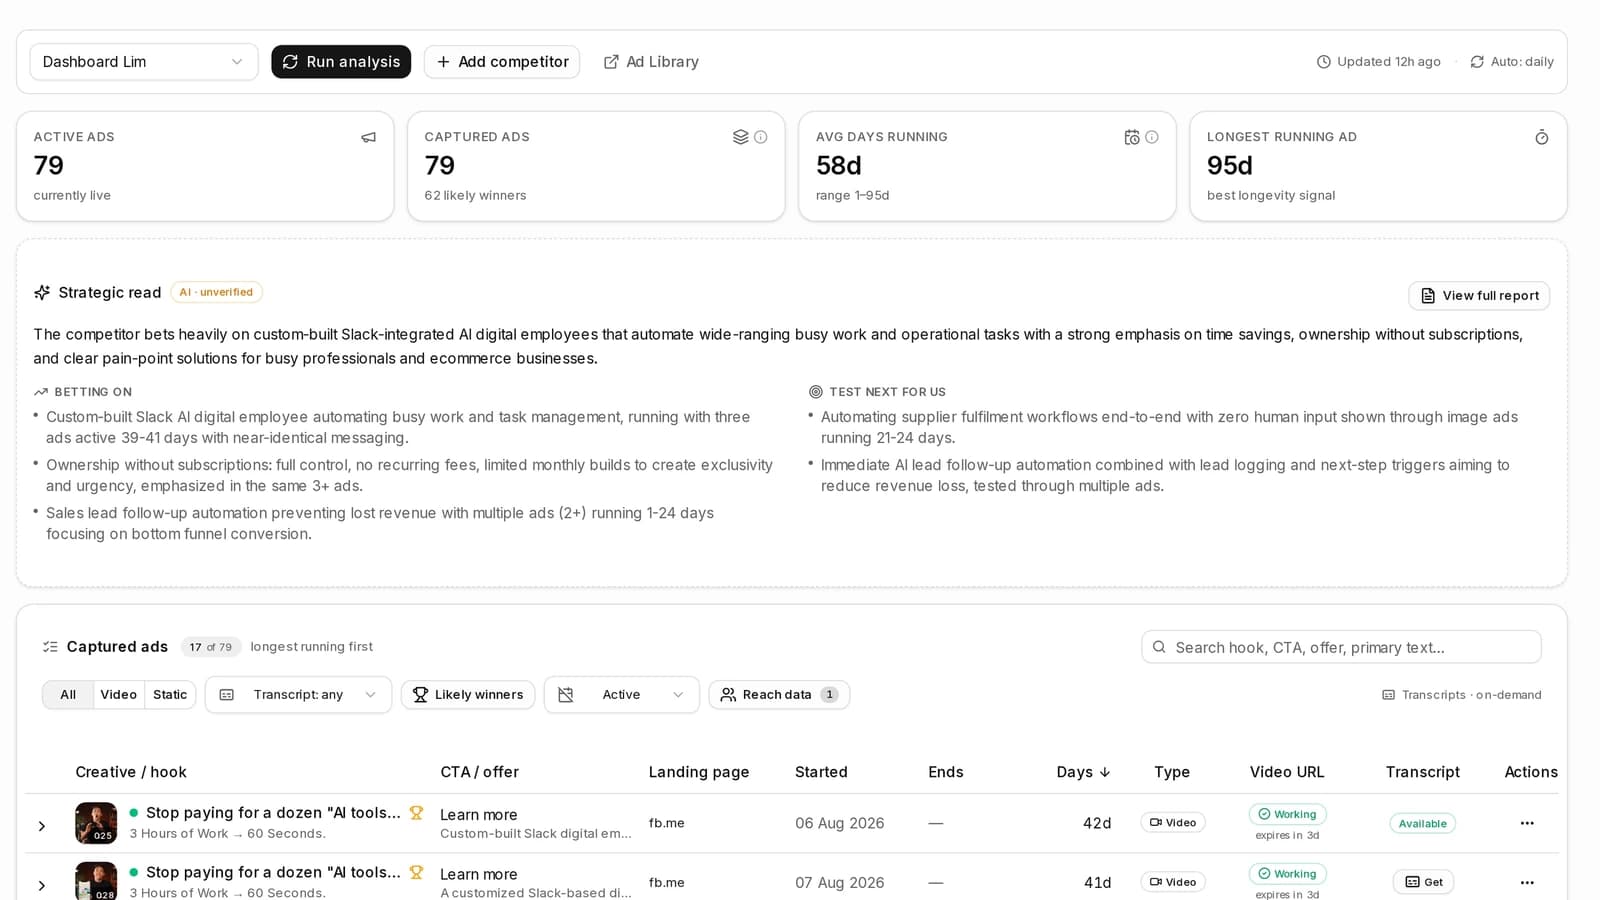
We were losing the thread on what competitors were running. So we built a system that watches every brand on a schedule, keeps every ad it finds, and reads the whole set back as strategy.

The Competitor Ads Spy screen with one brand selected, reading 79 captured ads with 62 likely winners, 58 days average running and a longest running ad of 95 days, above a strategic read badged AI unverified and the captured ads table.
40+brands on the watch list3,030competitor ads captured
Competitor ad intelligence

2026-09-17

Read the case study
Case Study

Sales & CRM

AI Sales Brain
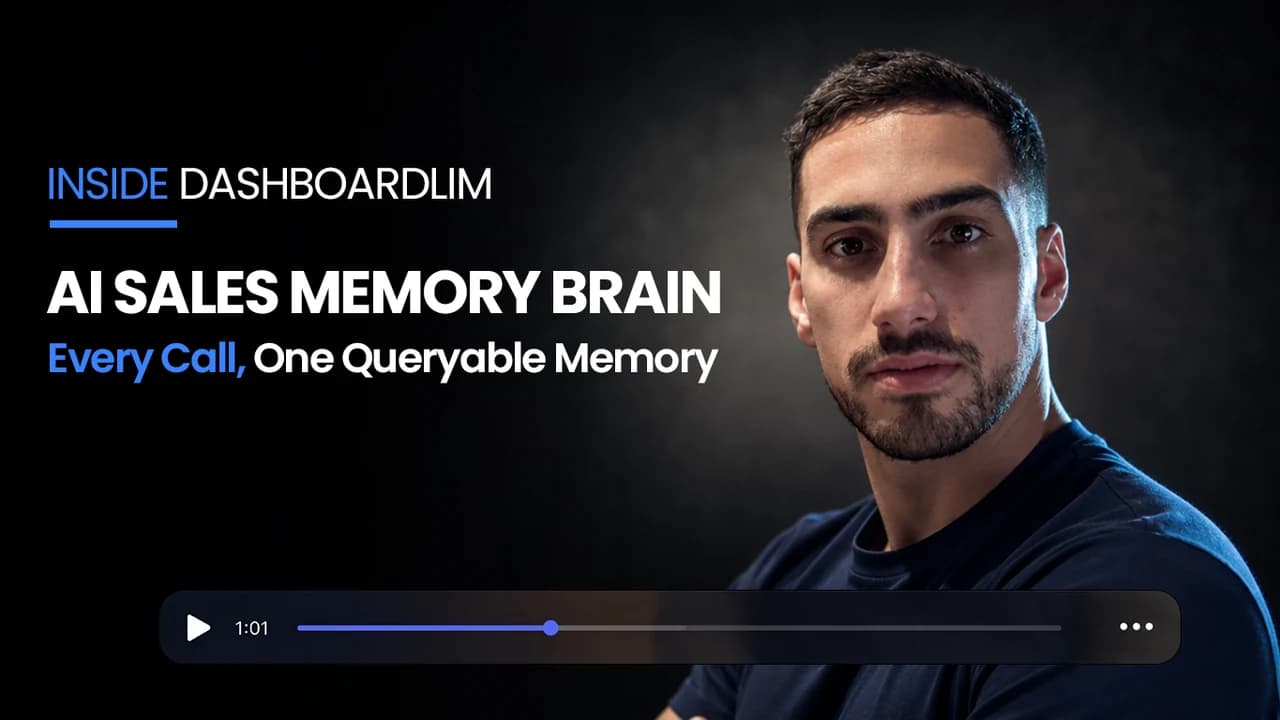
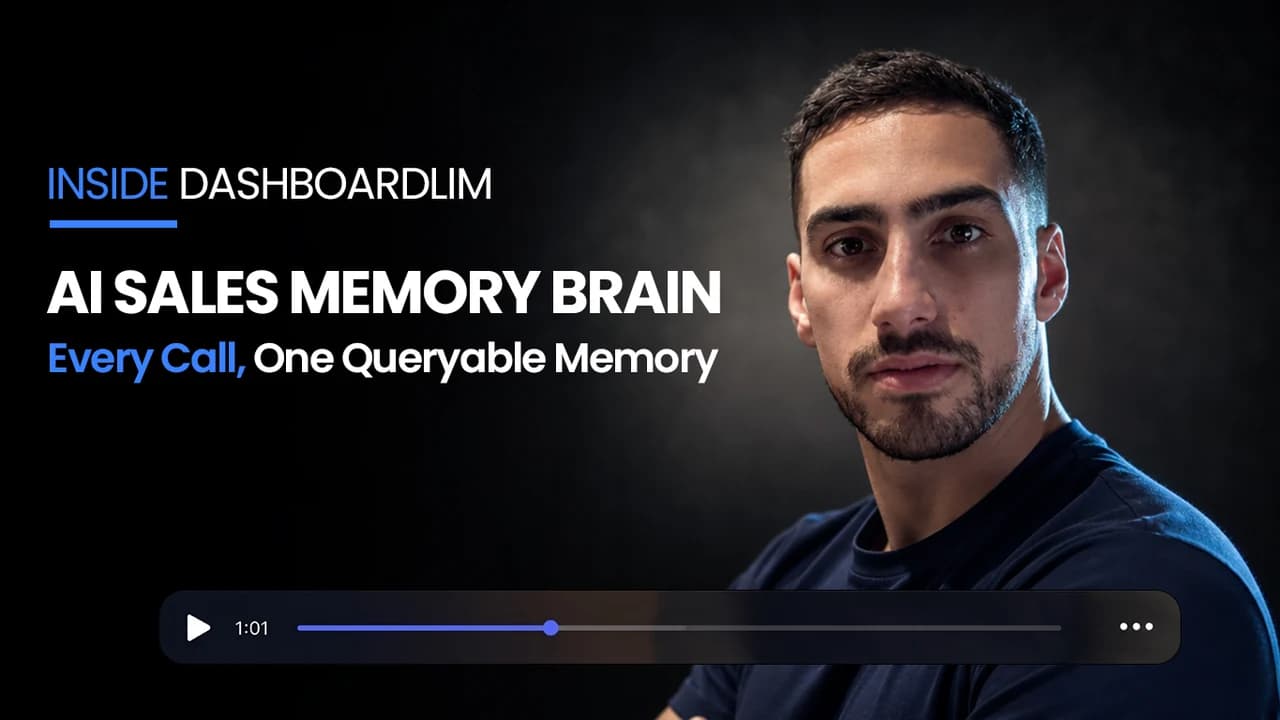
Every call the floor makes lands in one database with its transcript. We put an AI in front of that database. Now a manager can ask where a rep is losing calls and get the calls themselves back, not a score.

Cover for the AI Sales Brain walkthrough: the client on camera beside the title "AI Sales Memory Brain, Every Call, One Queryable Memory", with a play bar across the foot of the frame.
52calls behind one answer239minutes of conversation read back
Sales call intelligence

2026-09-07

Read the case study
Newsletter

Operations

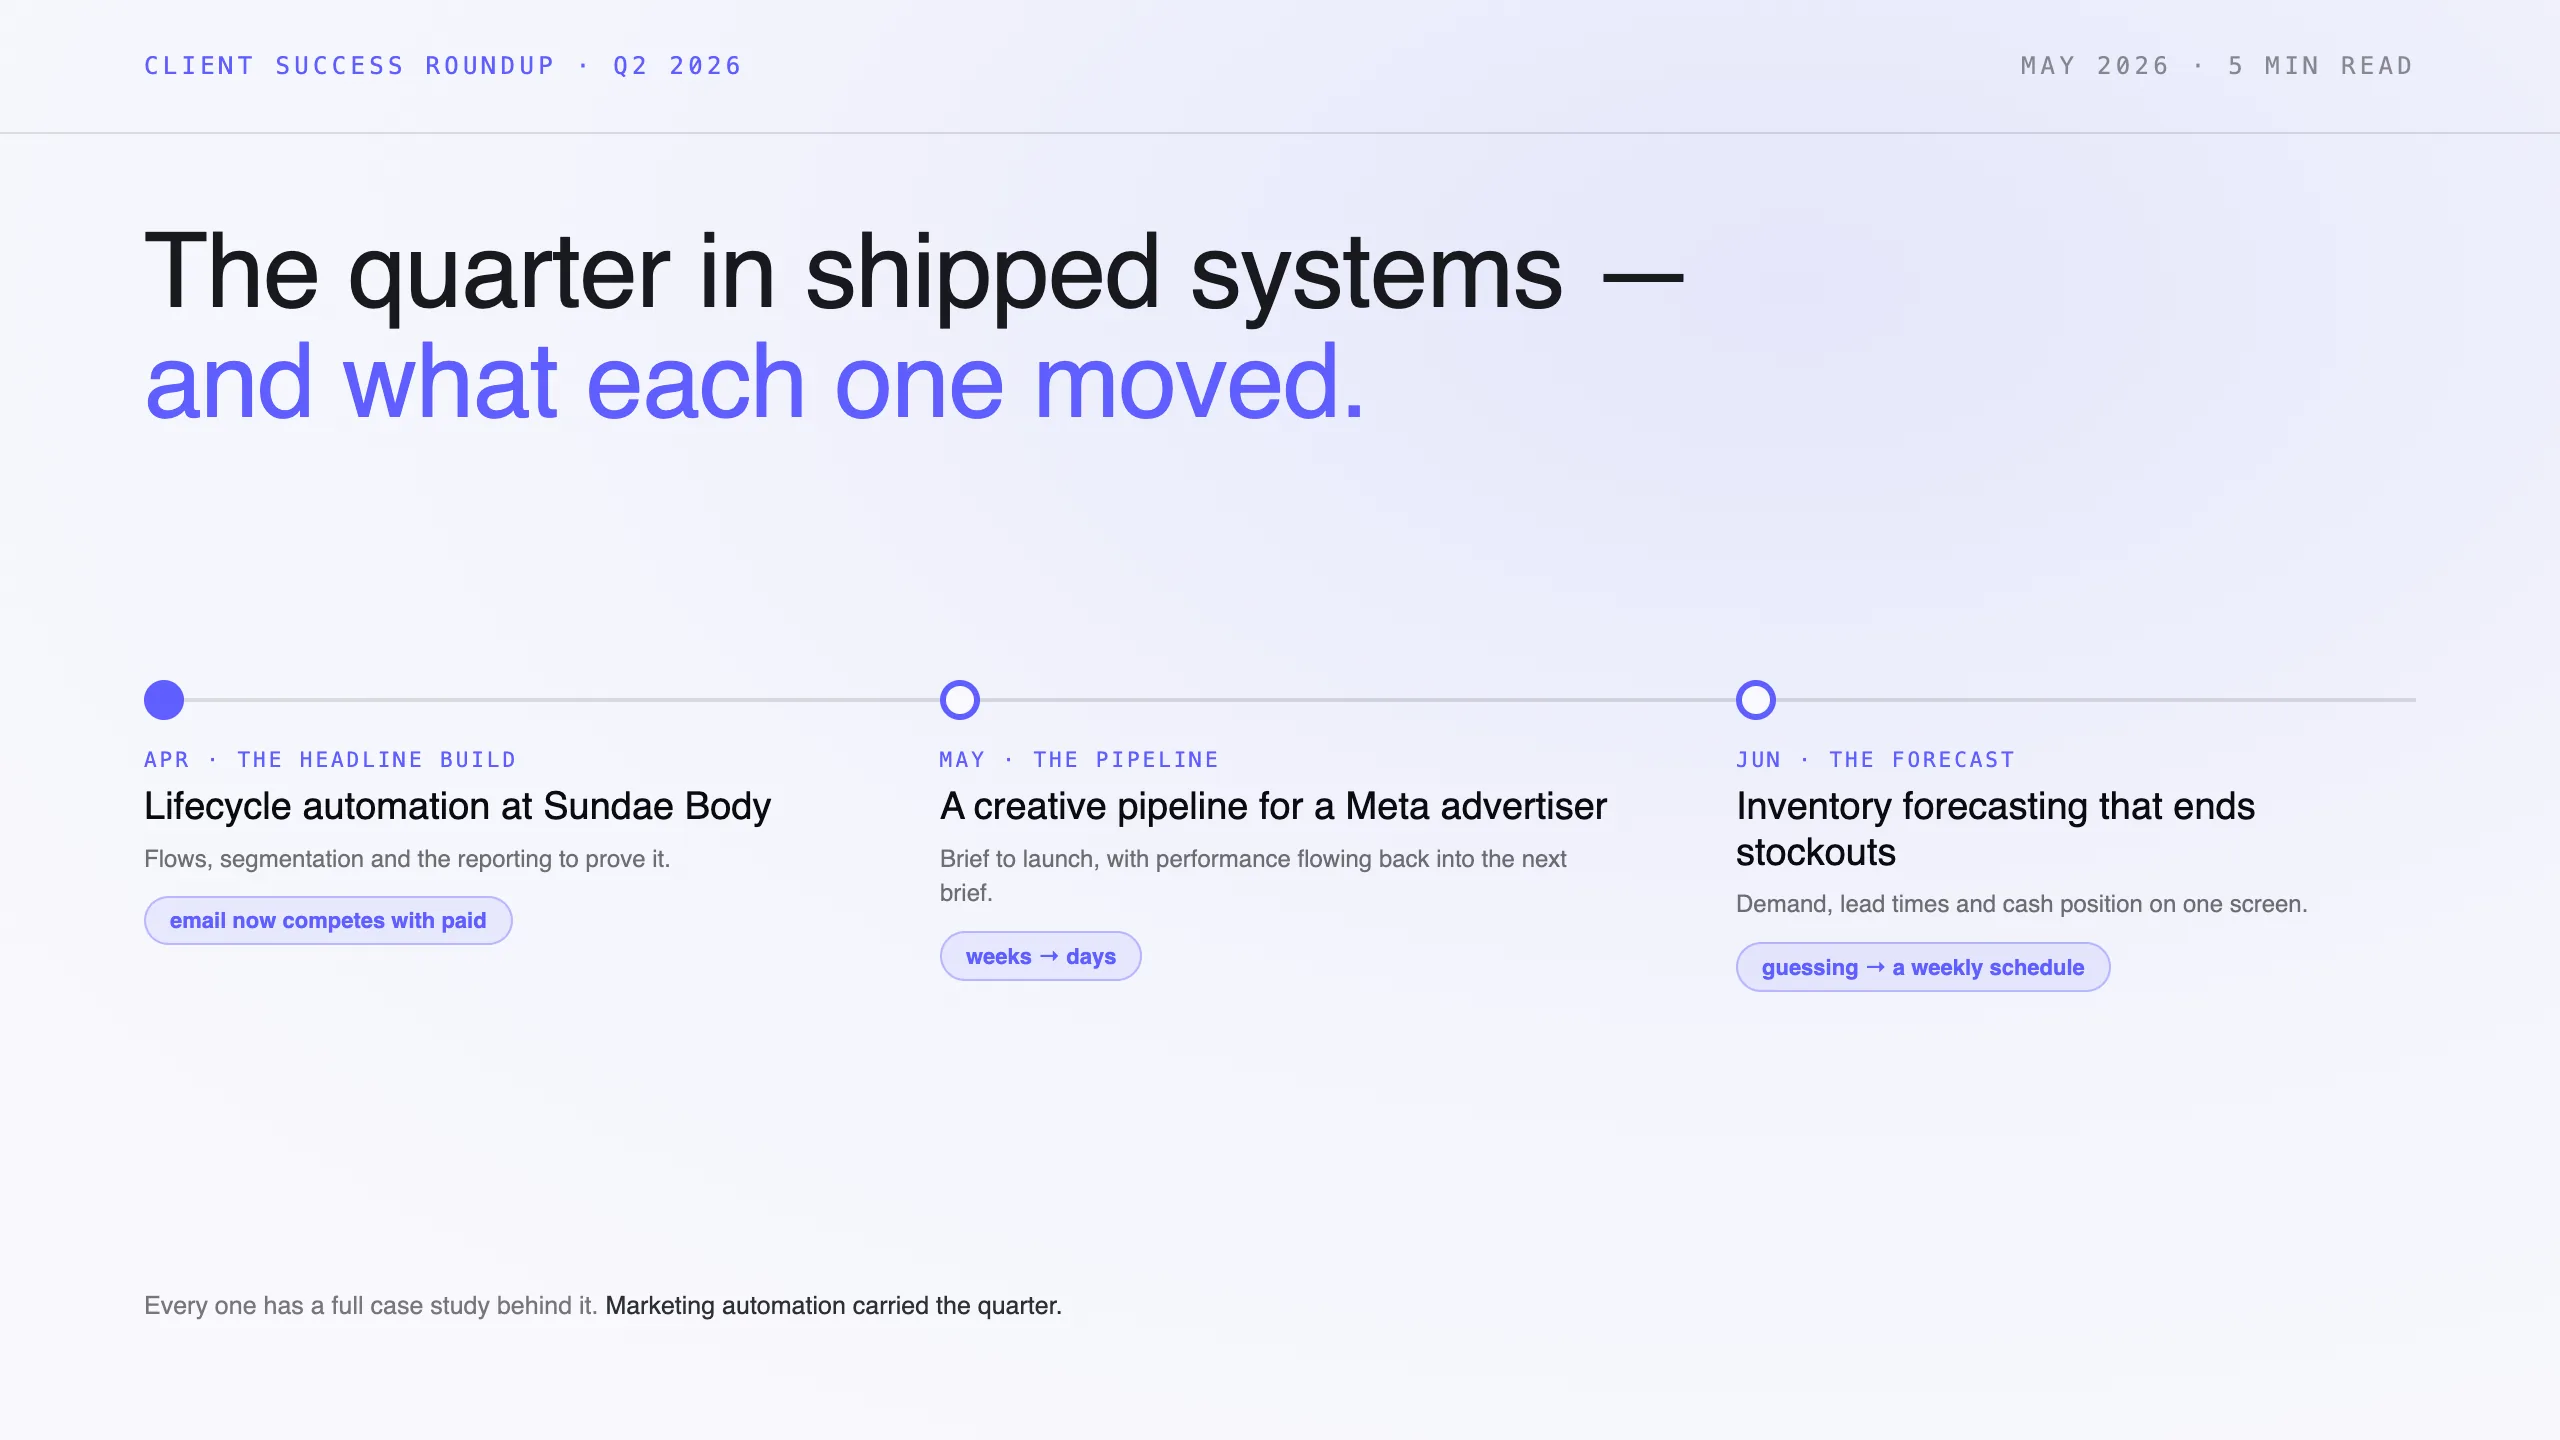
What we shipped last quarter, and what it changed
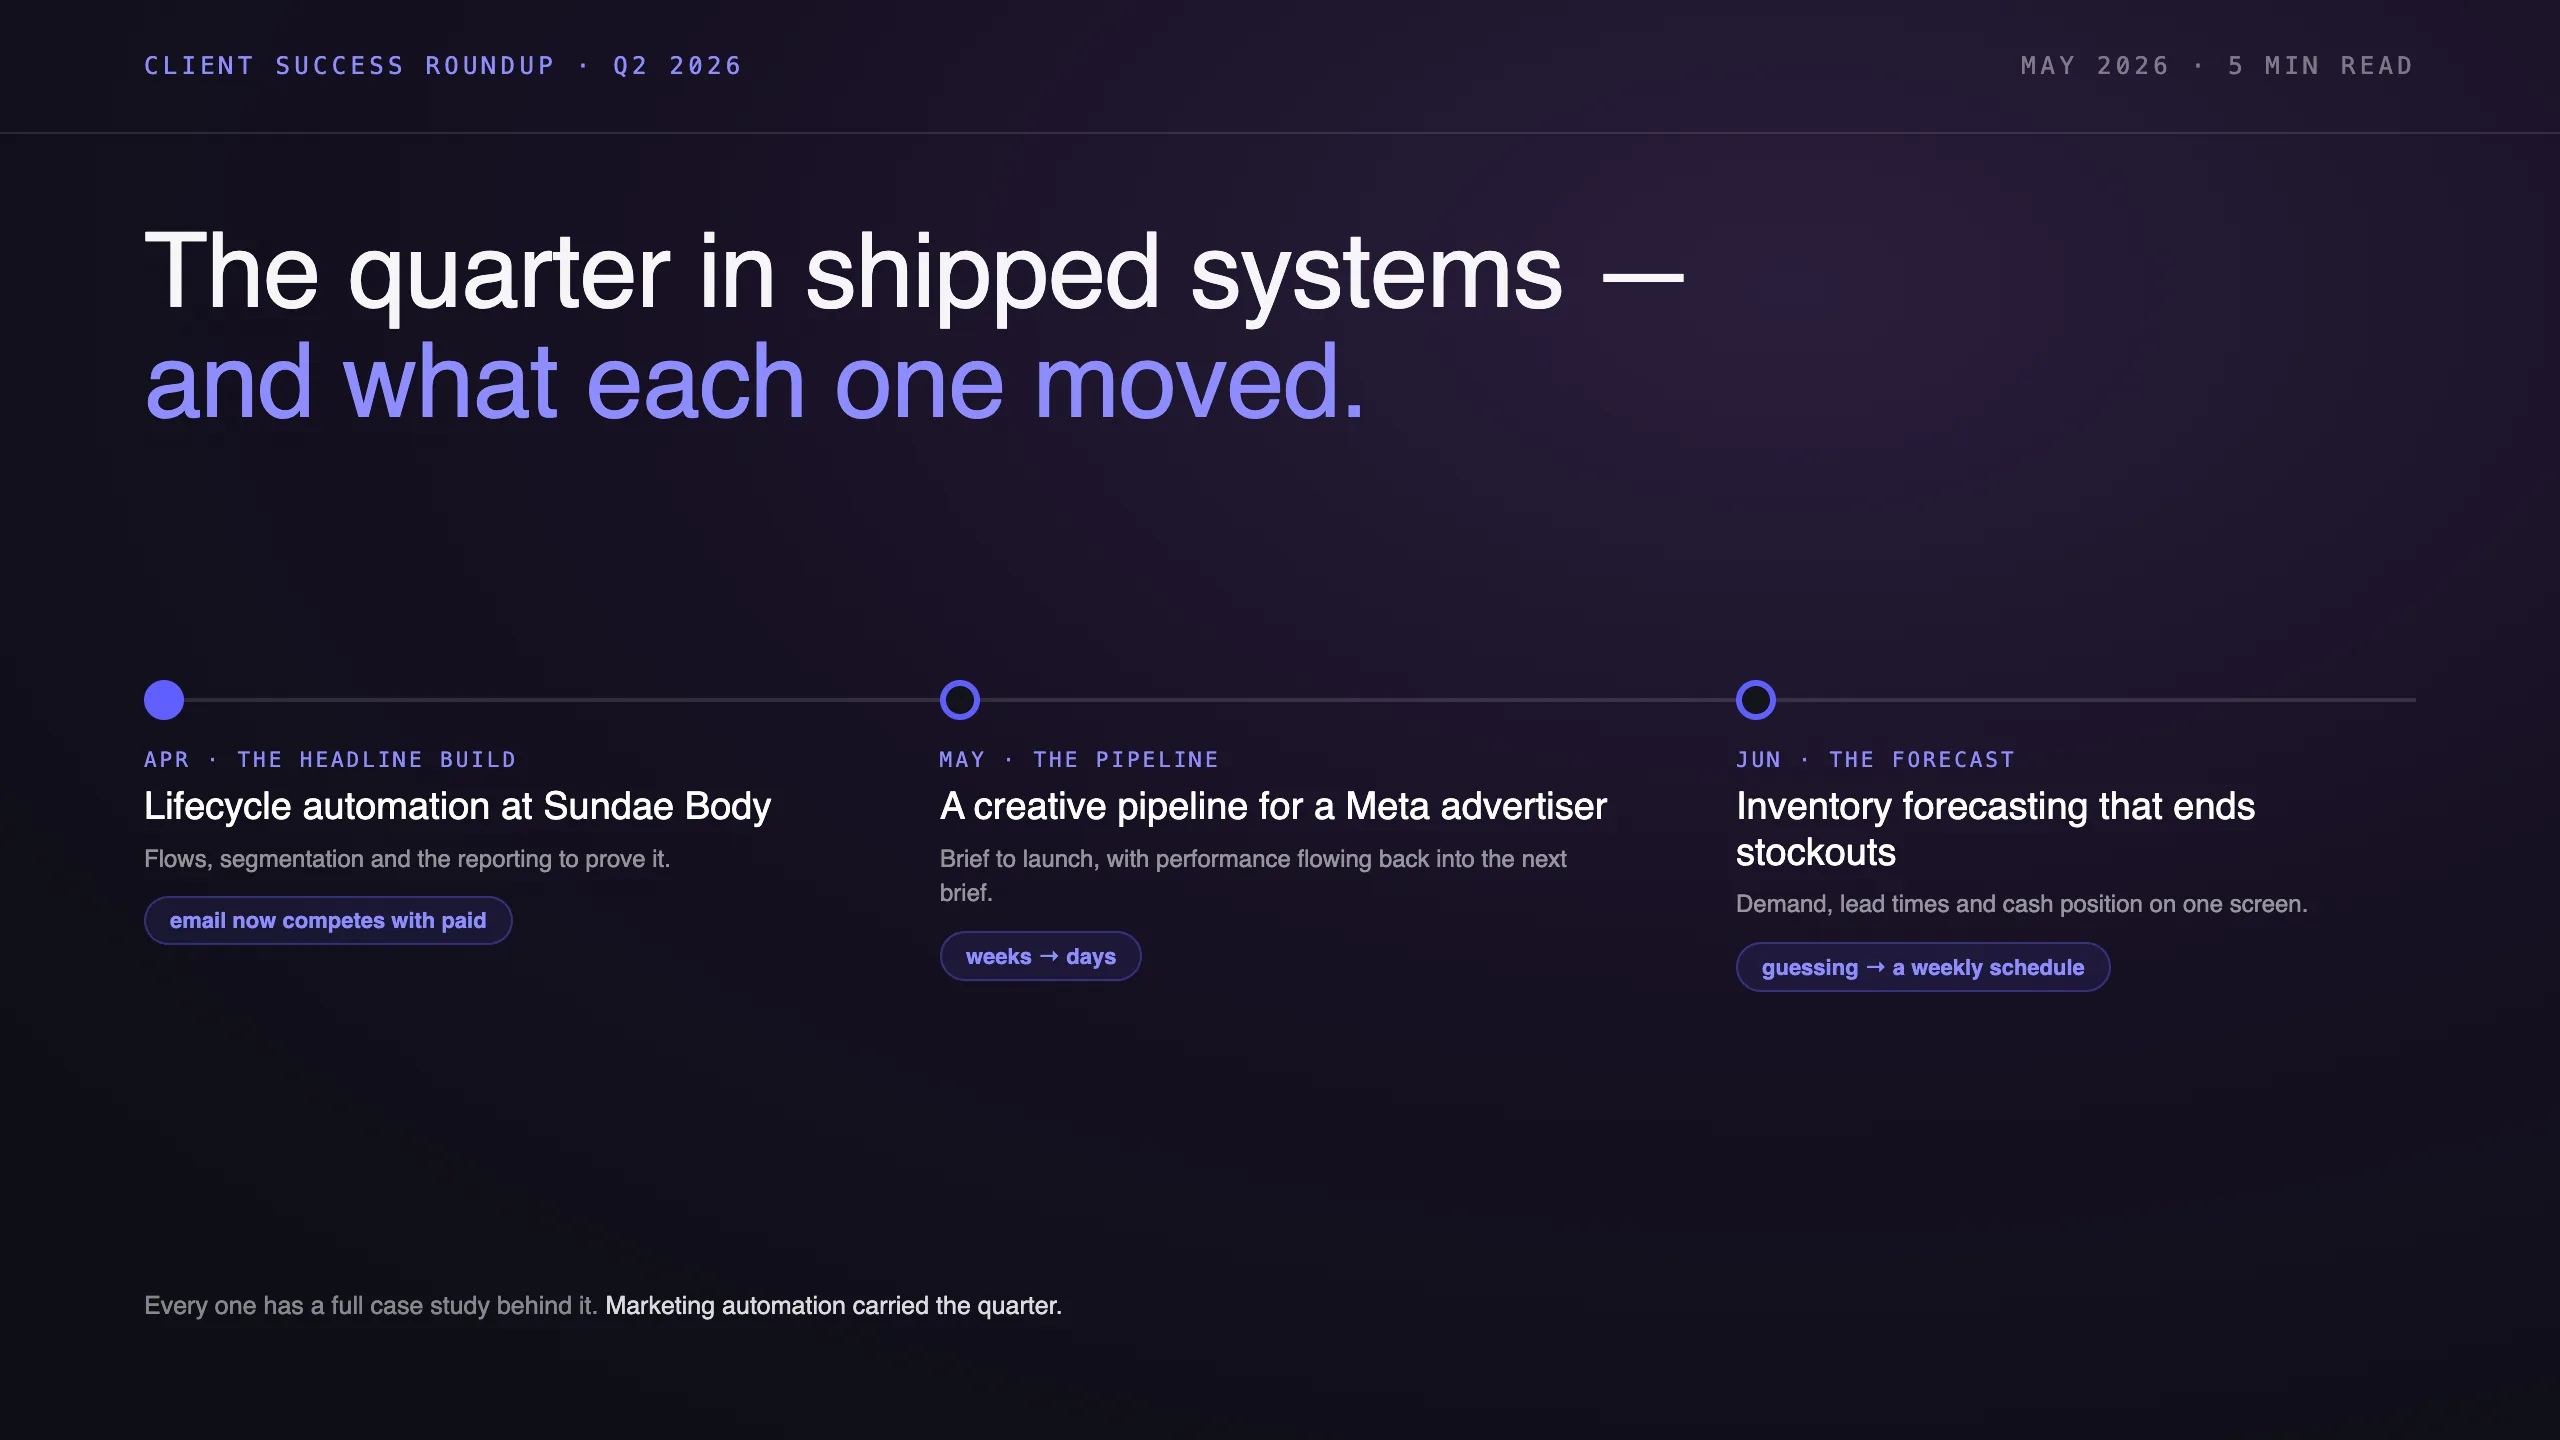
Three systems we built last quarter, and the screens behind them.

The founder inbox command centre we built, showing 87 messages in the day's feed, 6 processed, 1 AI drafted, 5 AI flagged, 3 human needed, 0 refunds, 1 urgent, 81 dropped, a 0.94 average confidence and a 17 percent automation rate, with the alert queue beneath.

We built three systems for clients last quarter. Every one of them stops at a person, and that is why the teams trust them.

5 min read

2026-09-04

Read the issue
Case Study

Sales & CRM

Sales Command Center
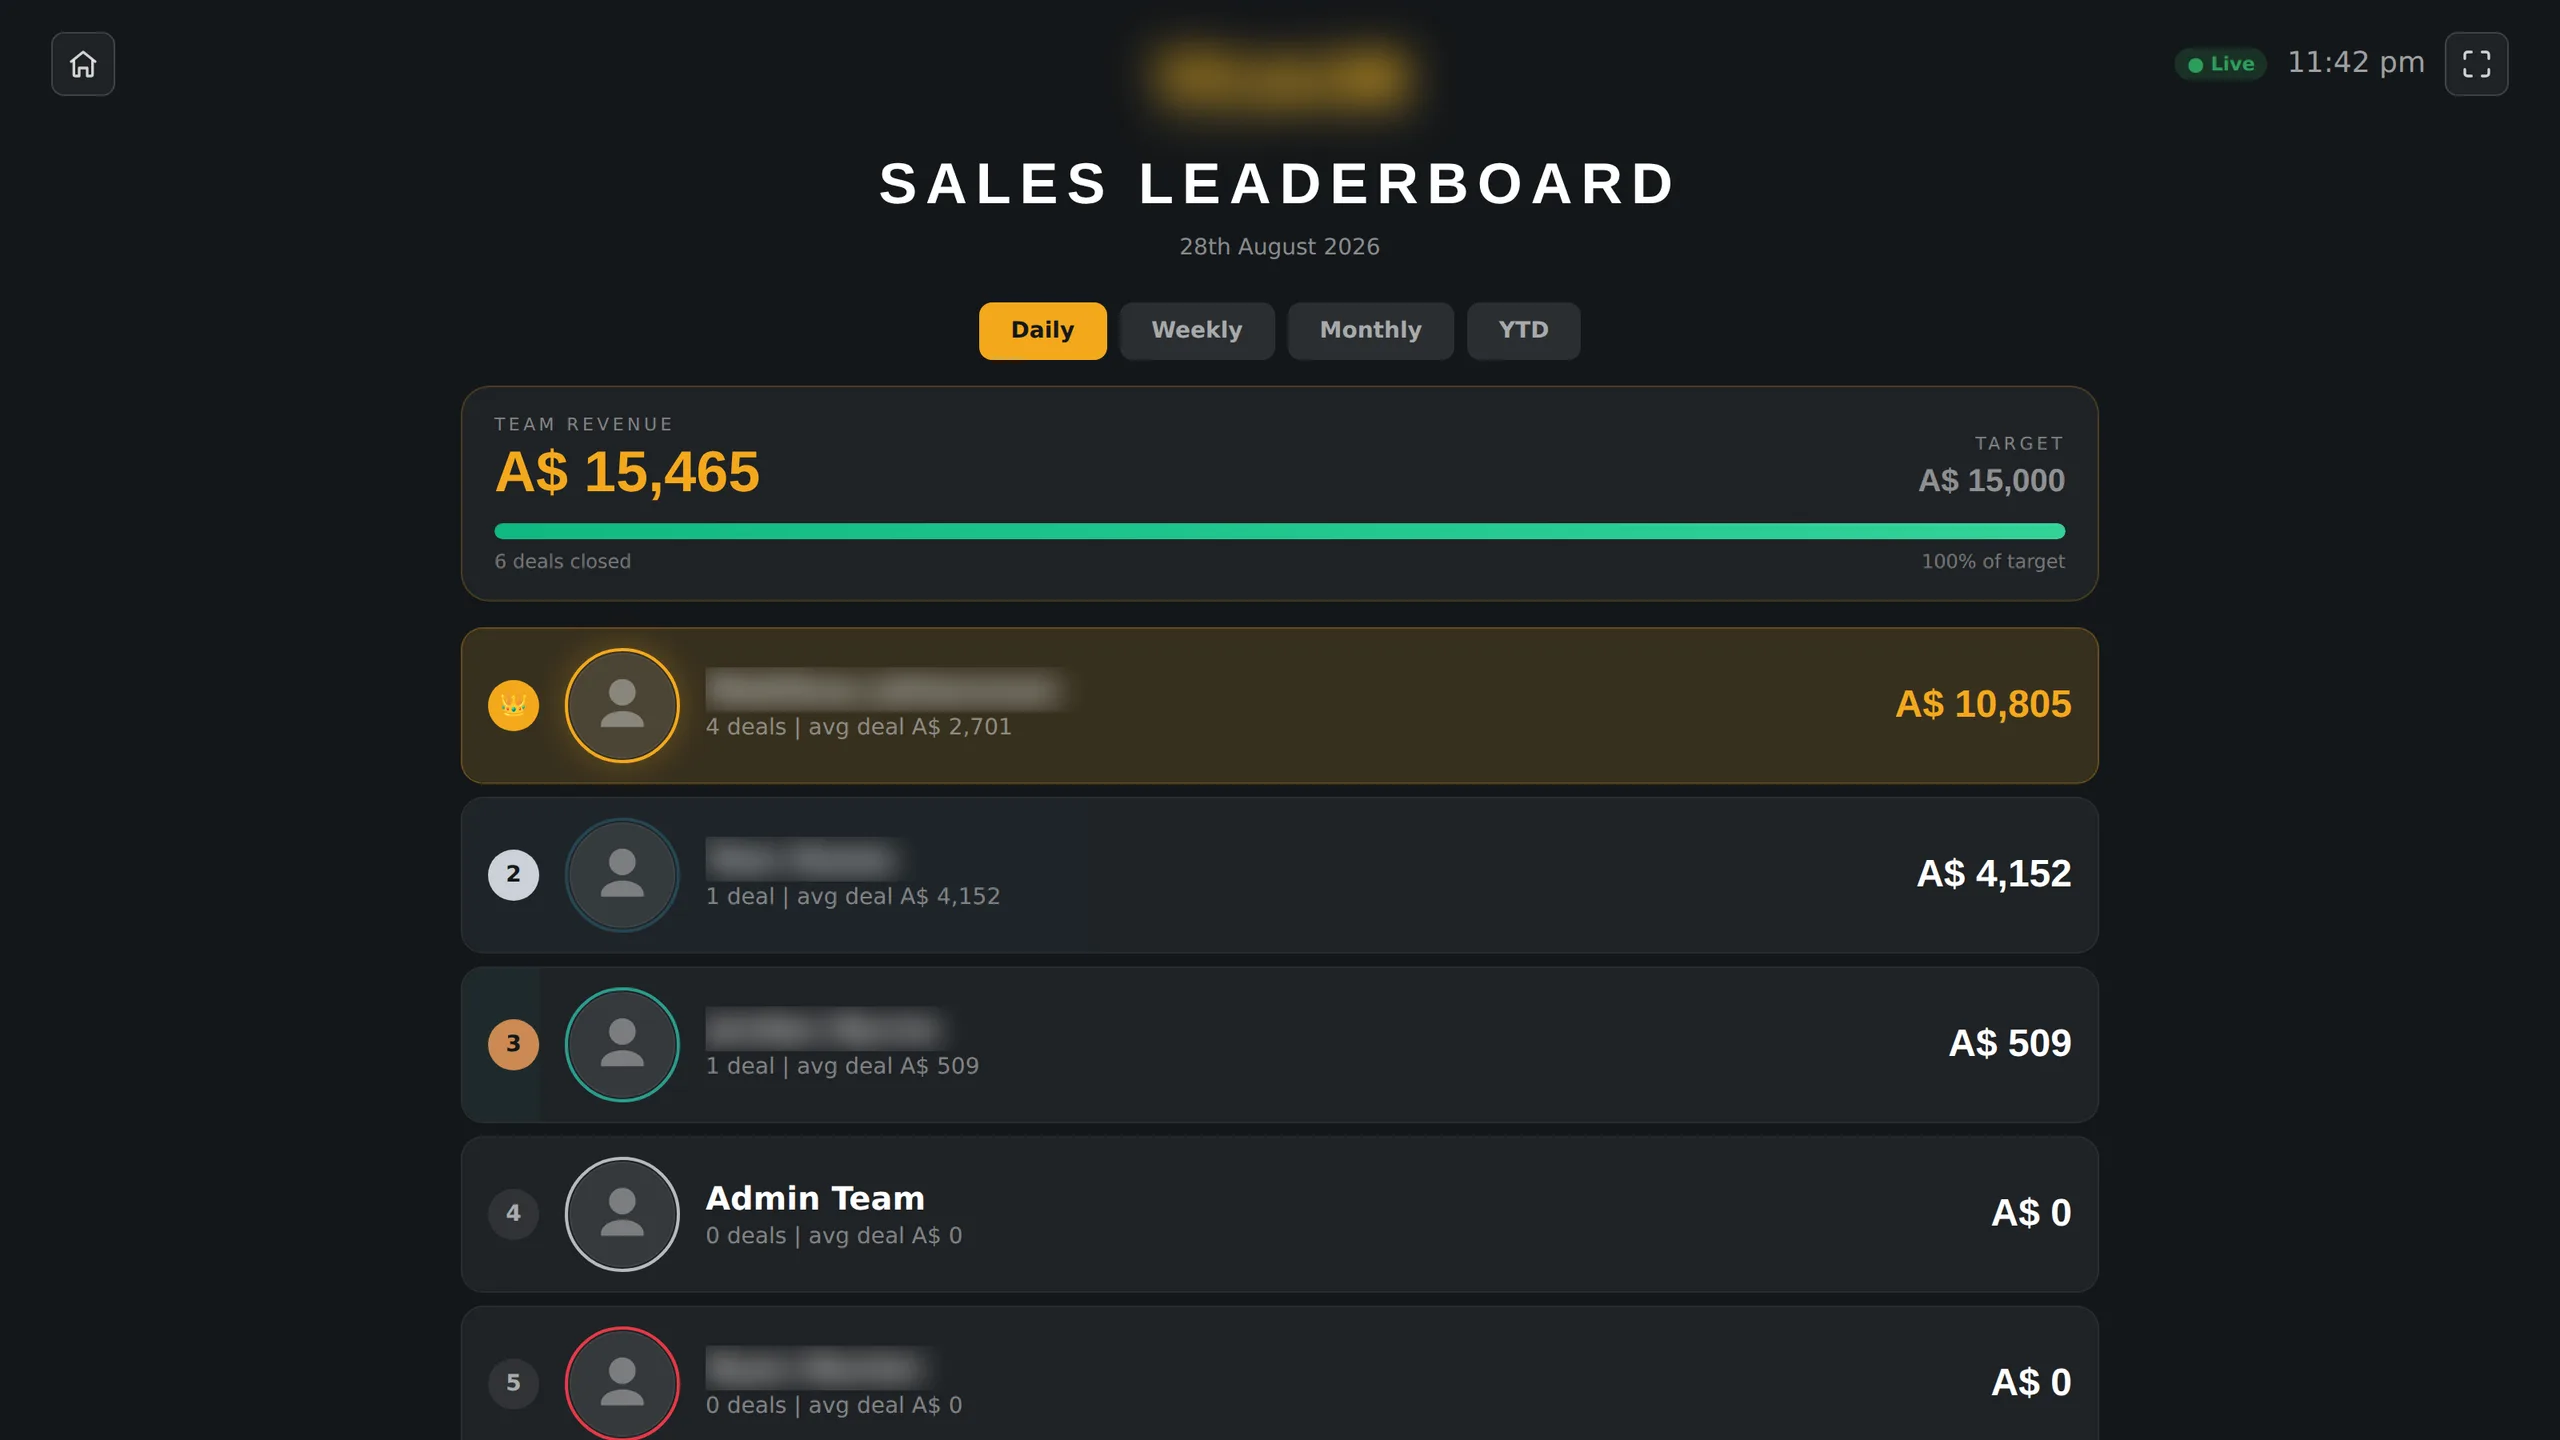
Ads were working. The backend was not. We reset how the CRM was used, automated the record hygiene, built a trusted data layer on top of it, and only then built the Sales Command Center — so the founder and the sales floor finally read the same live numbers.

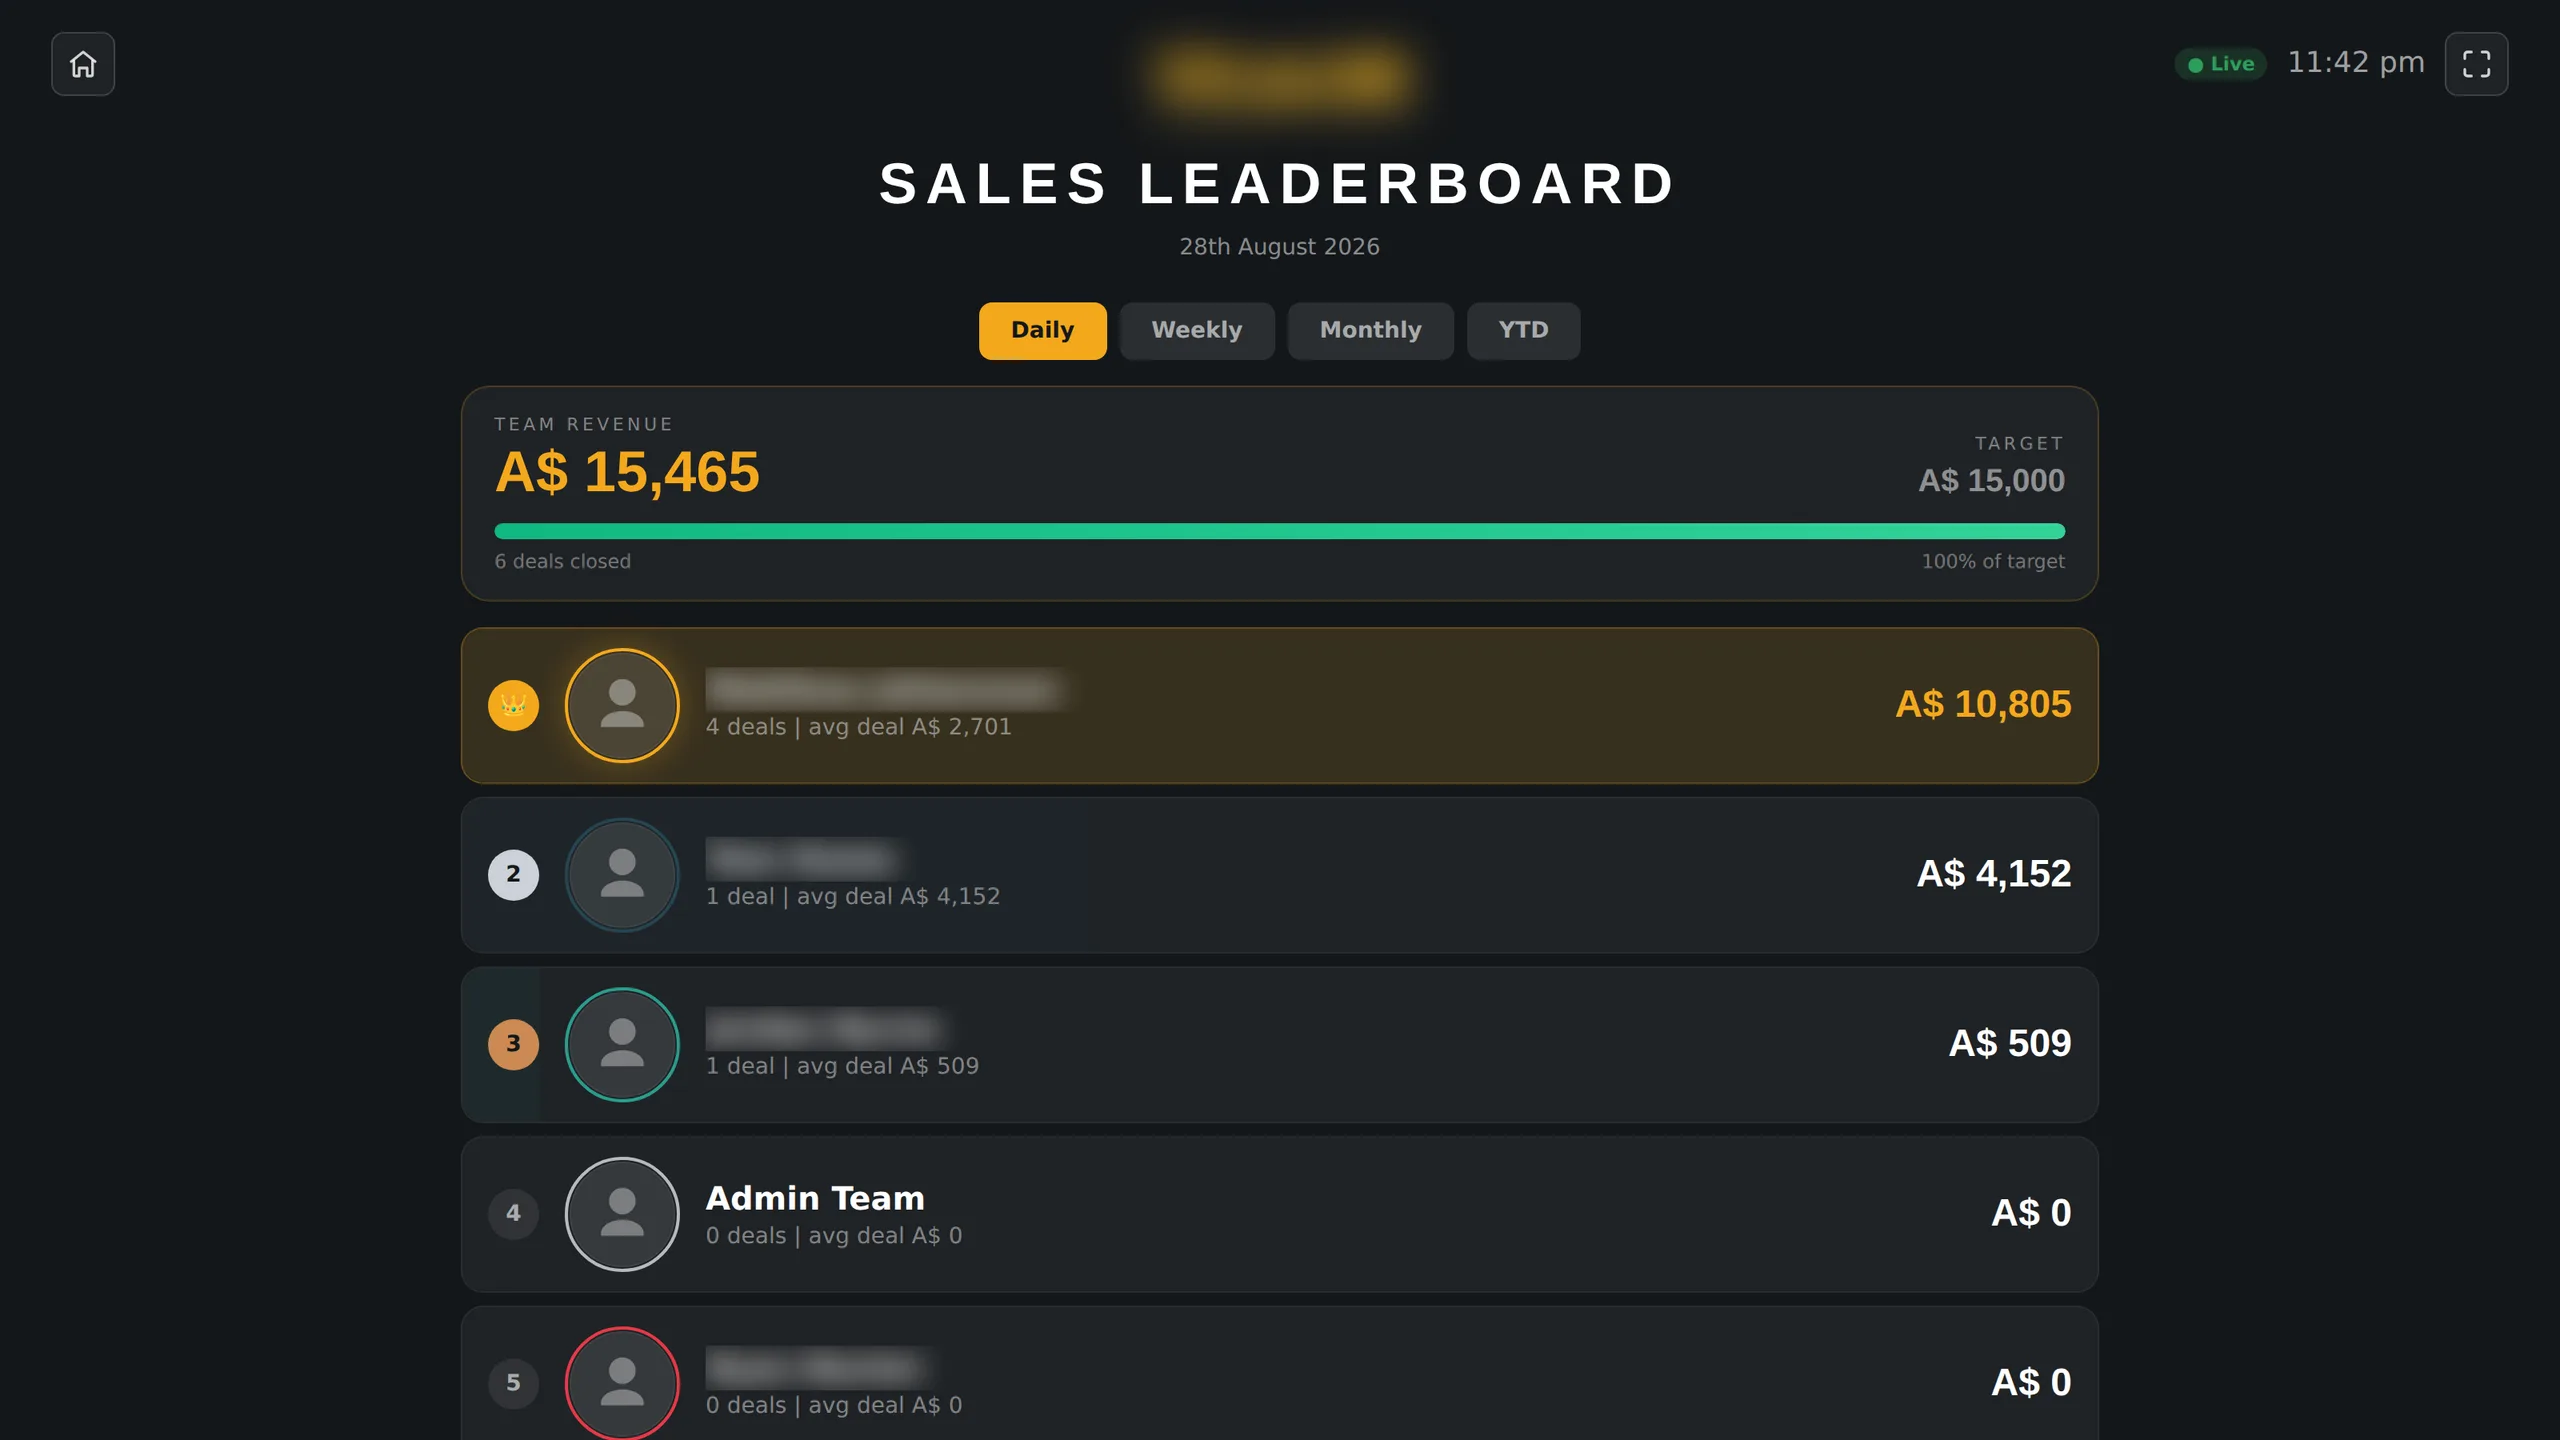
The sales team performance dashboard, marked live, on its last-thirty-days range: six headline tiles — revenue generated (masked as a confidential total), six hundred and sixty-nine appointments booked, one day of inbound talk time, eight days six hours of outbound talk time, one hundred and forty-six inbound dials and four thousand and fifty-two outbound dials, each with its change against the previous period. Below them a revenue-by-rep donut totalling the same masked figure, and a detail table ranking each rep by revenue with their appointments, discovery calls, follow-ups, support contacts and assessments.
5source tables feeding one trusted layer6dashboards behind one sign-in
Sales performance system

2026-08-29

Read the case study
Case Study

Reporting & Dashboards

One Operating View Per Client
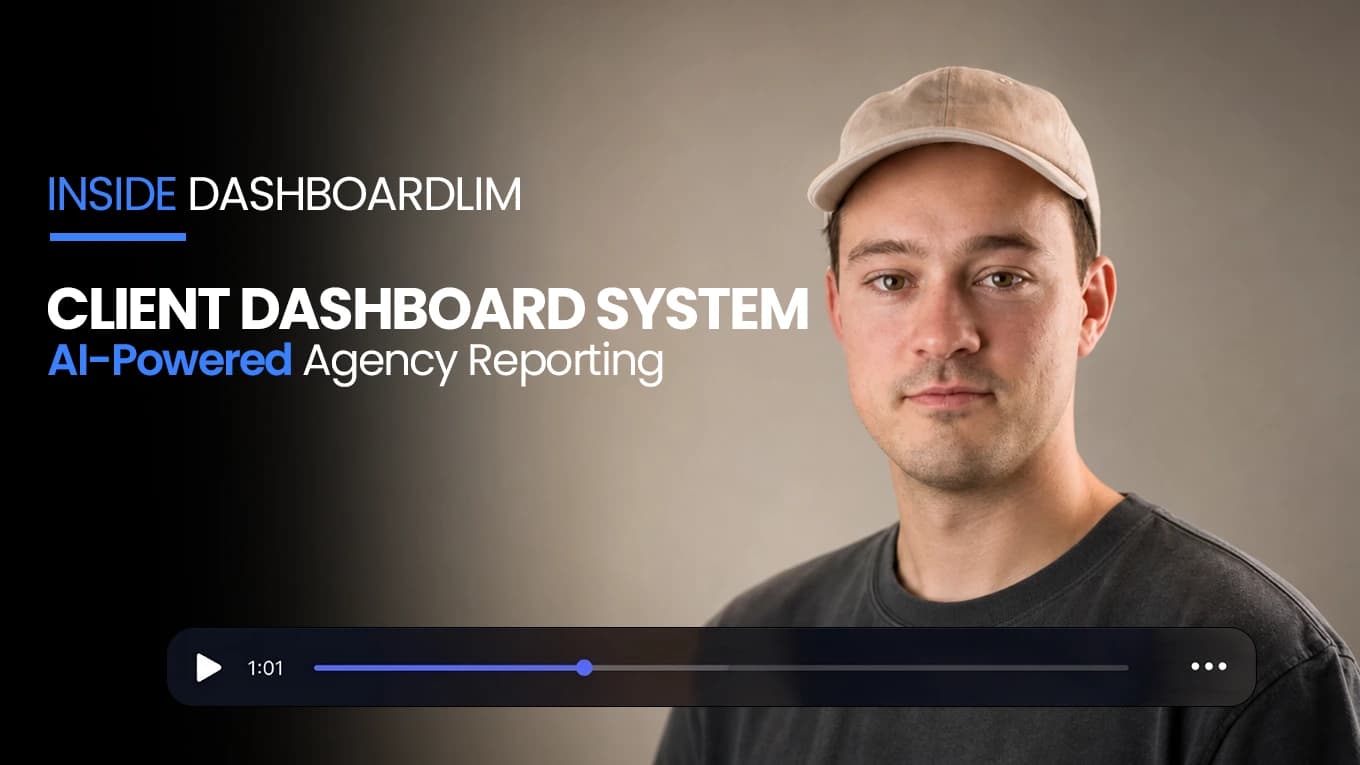
You do not have a reporting problem. You have the same reporting problem once per client. This system gives every client their own dashboard, all reading one warehouse, all driven by the same controls. Checking a client becomes a glance instead of a morning.

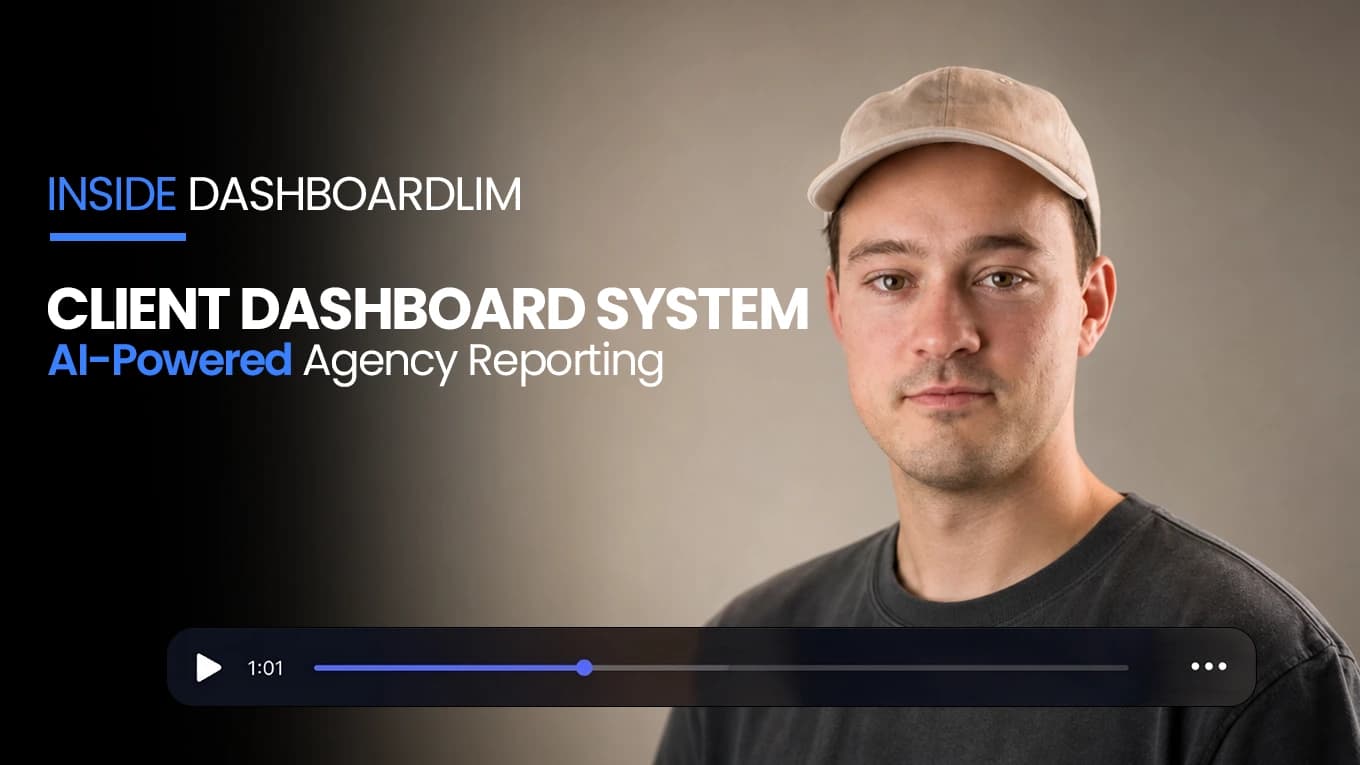
The cover of the Client Dashboard System walkthrough. A dark title panel on the left reads INSIDE DASHBOARDLIM above CLIENT DASHBOARD SYSTEM and AI-Powered Agency Reporting; a presenter in a light cap speaks to camera on the right; a video progress bar with a one minute one second running time sits across the bottom.
6client dashboards live on one deployment93weeks of history in the trend grid
Multi-client dashboard system

2026-08-28

Read the case study
Case Study

Reporting & Dashboards

CEO Profit Dashboard
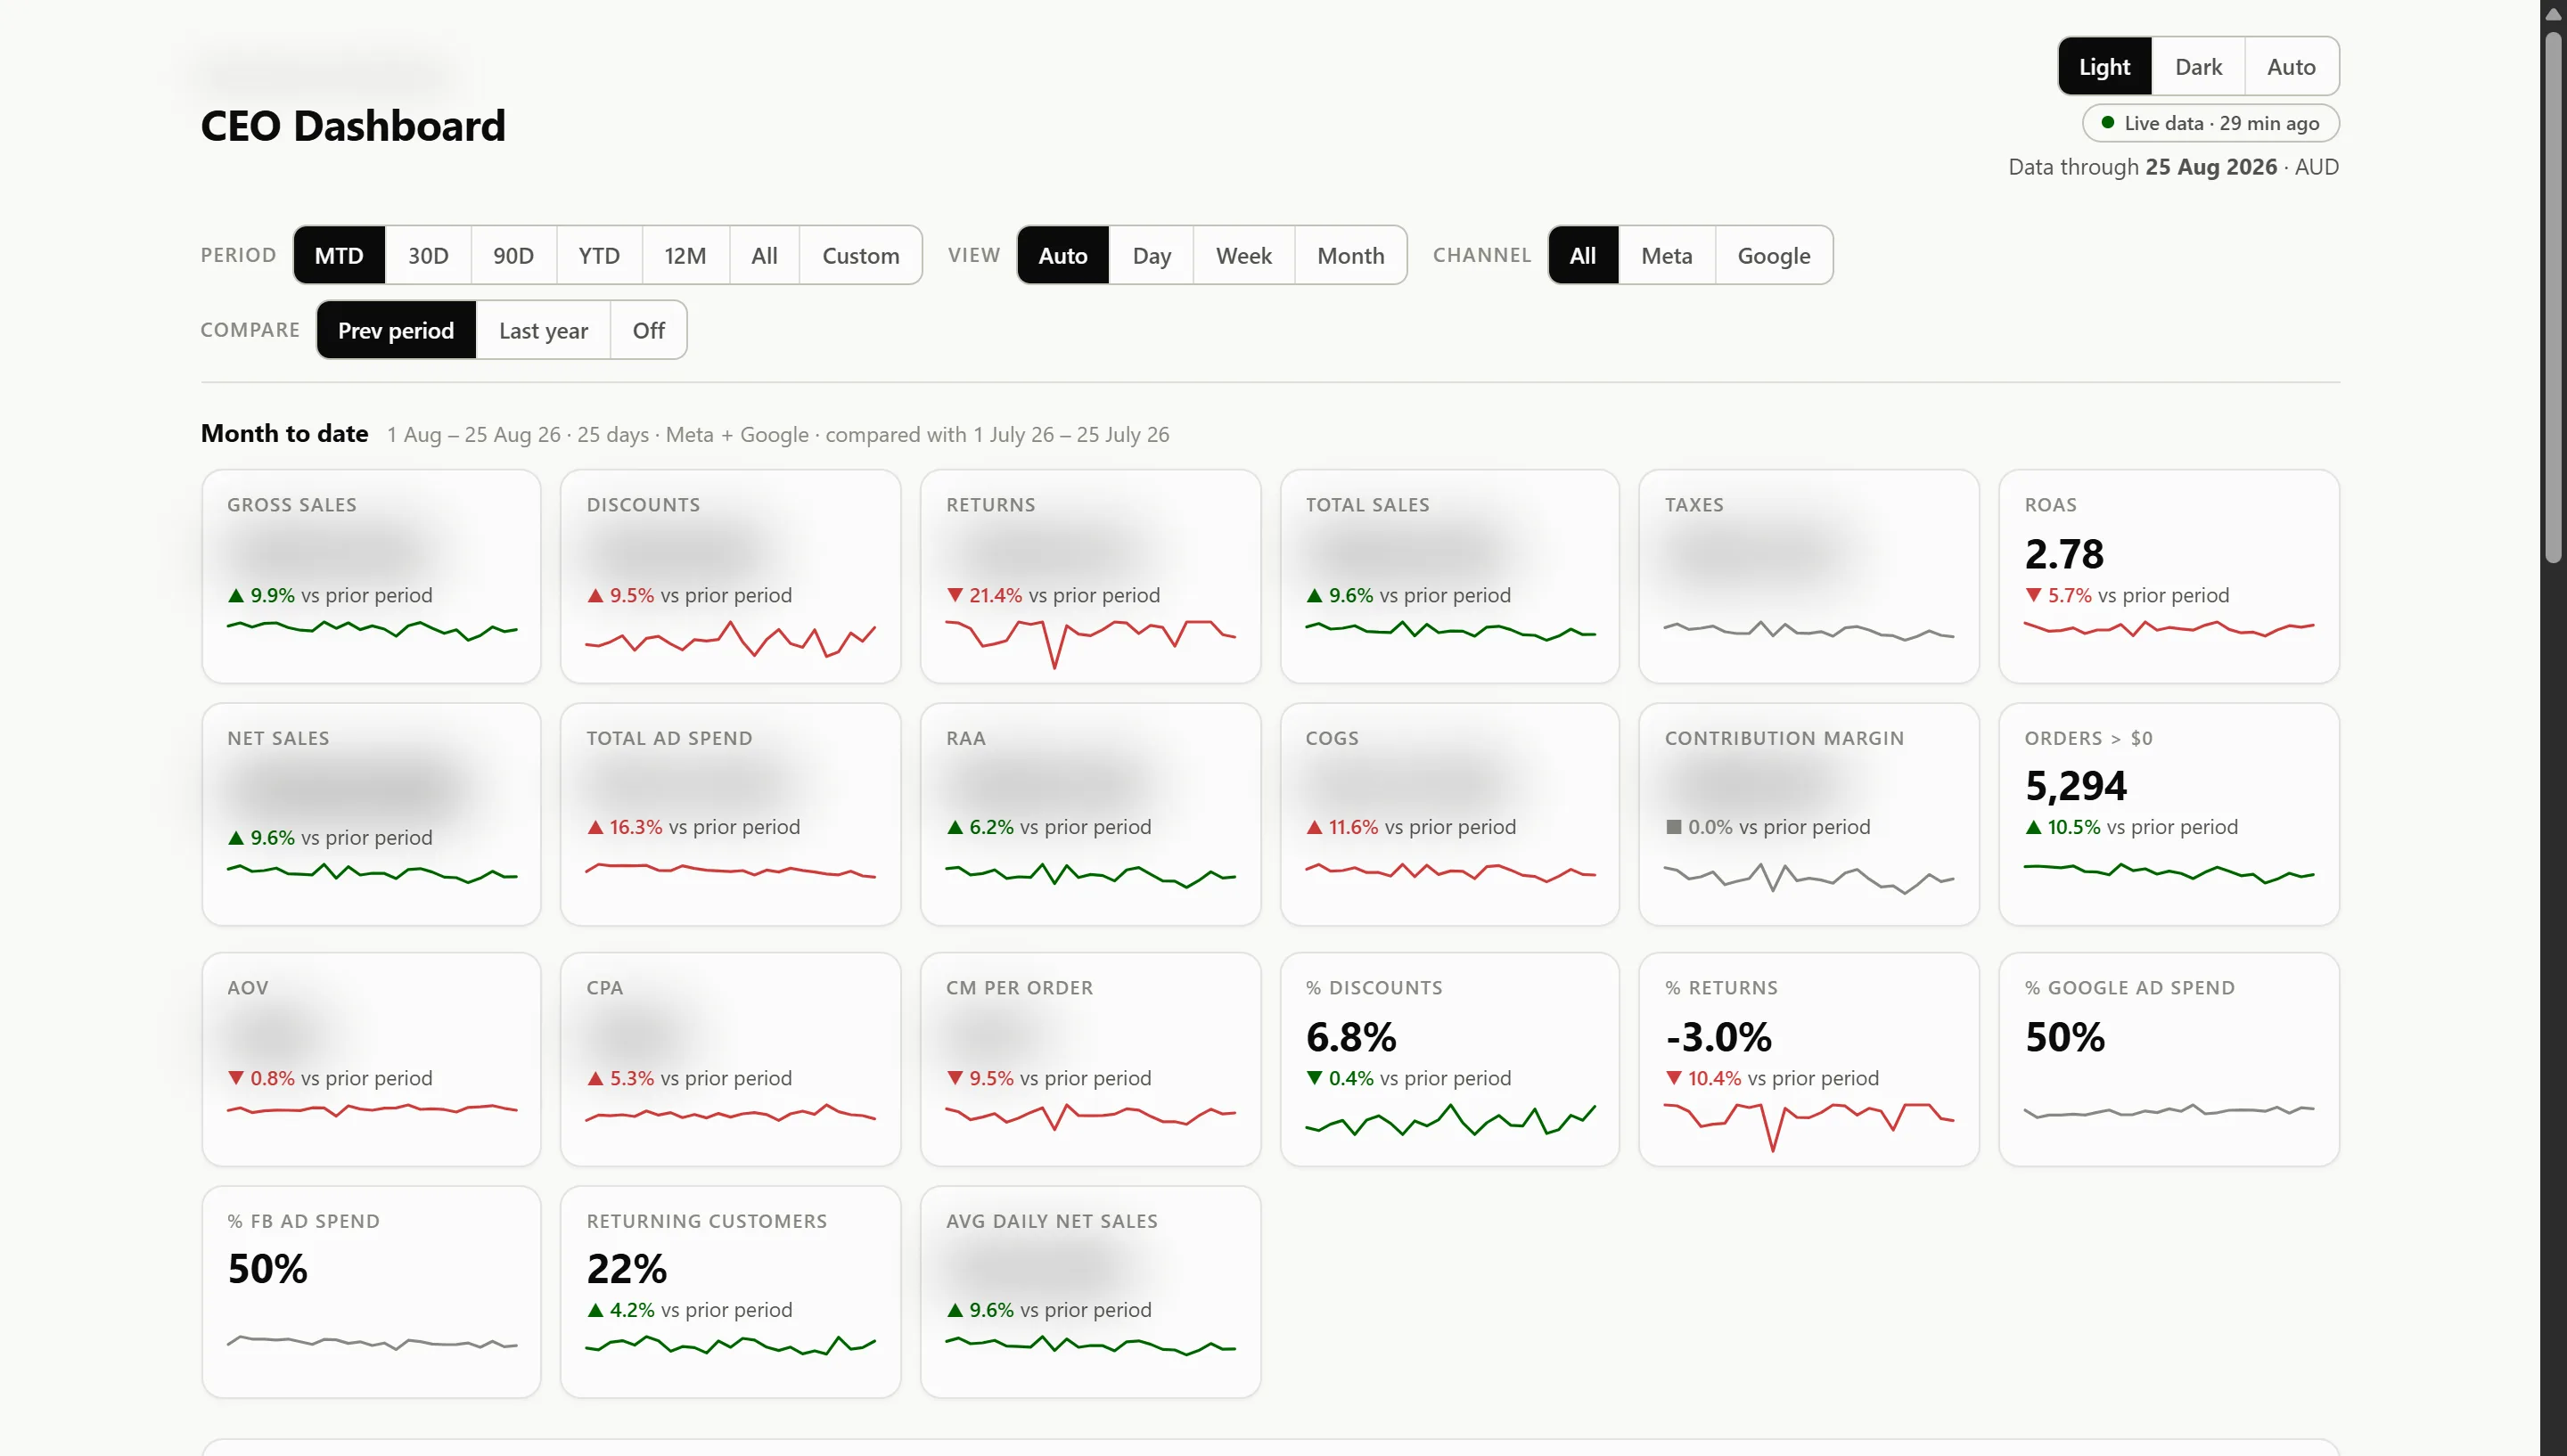
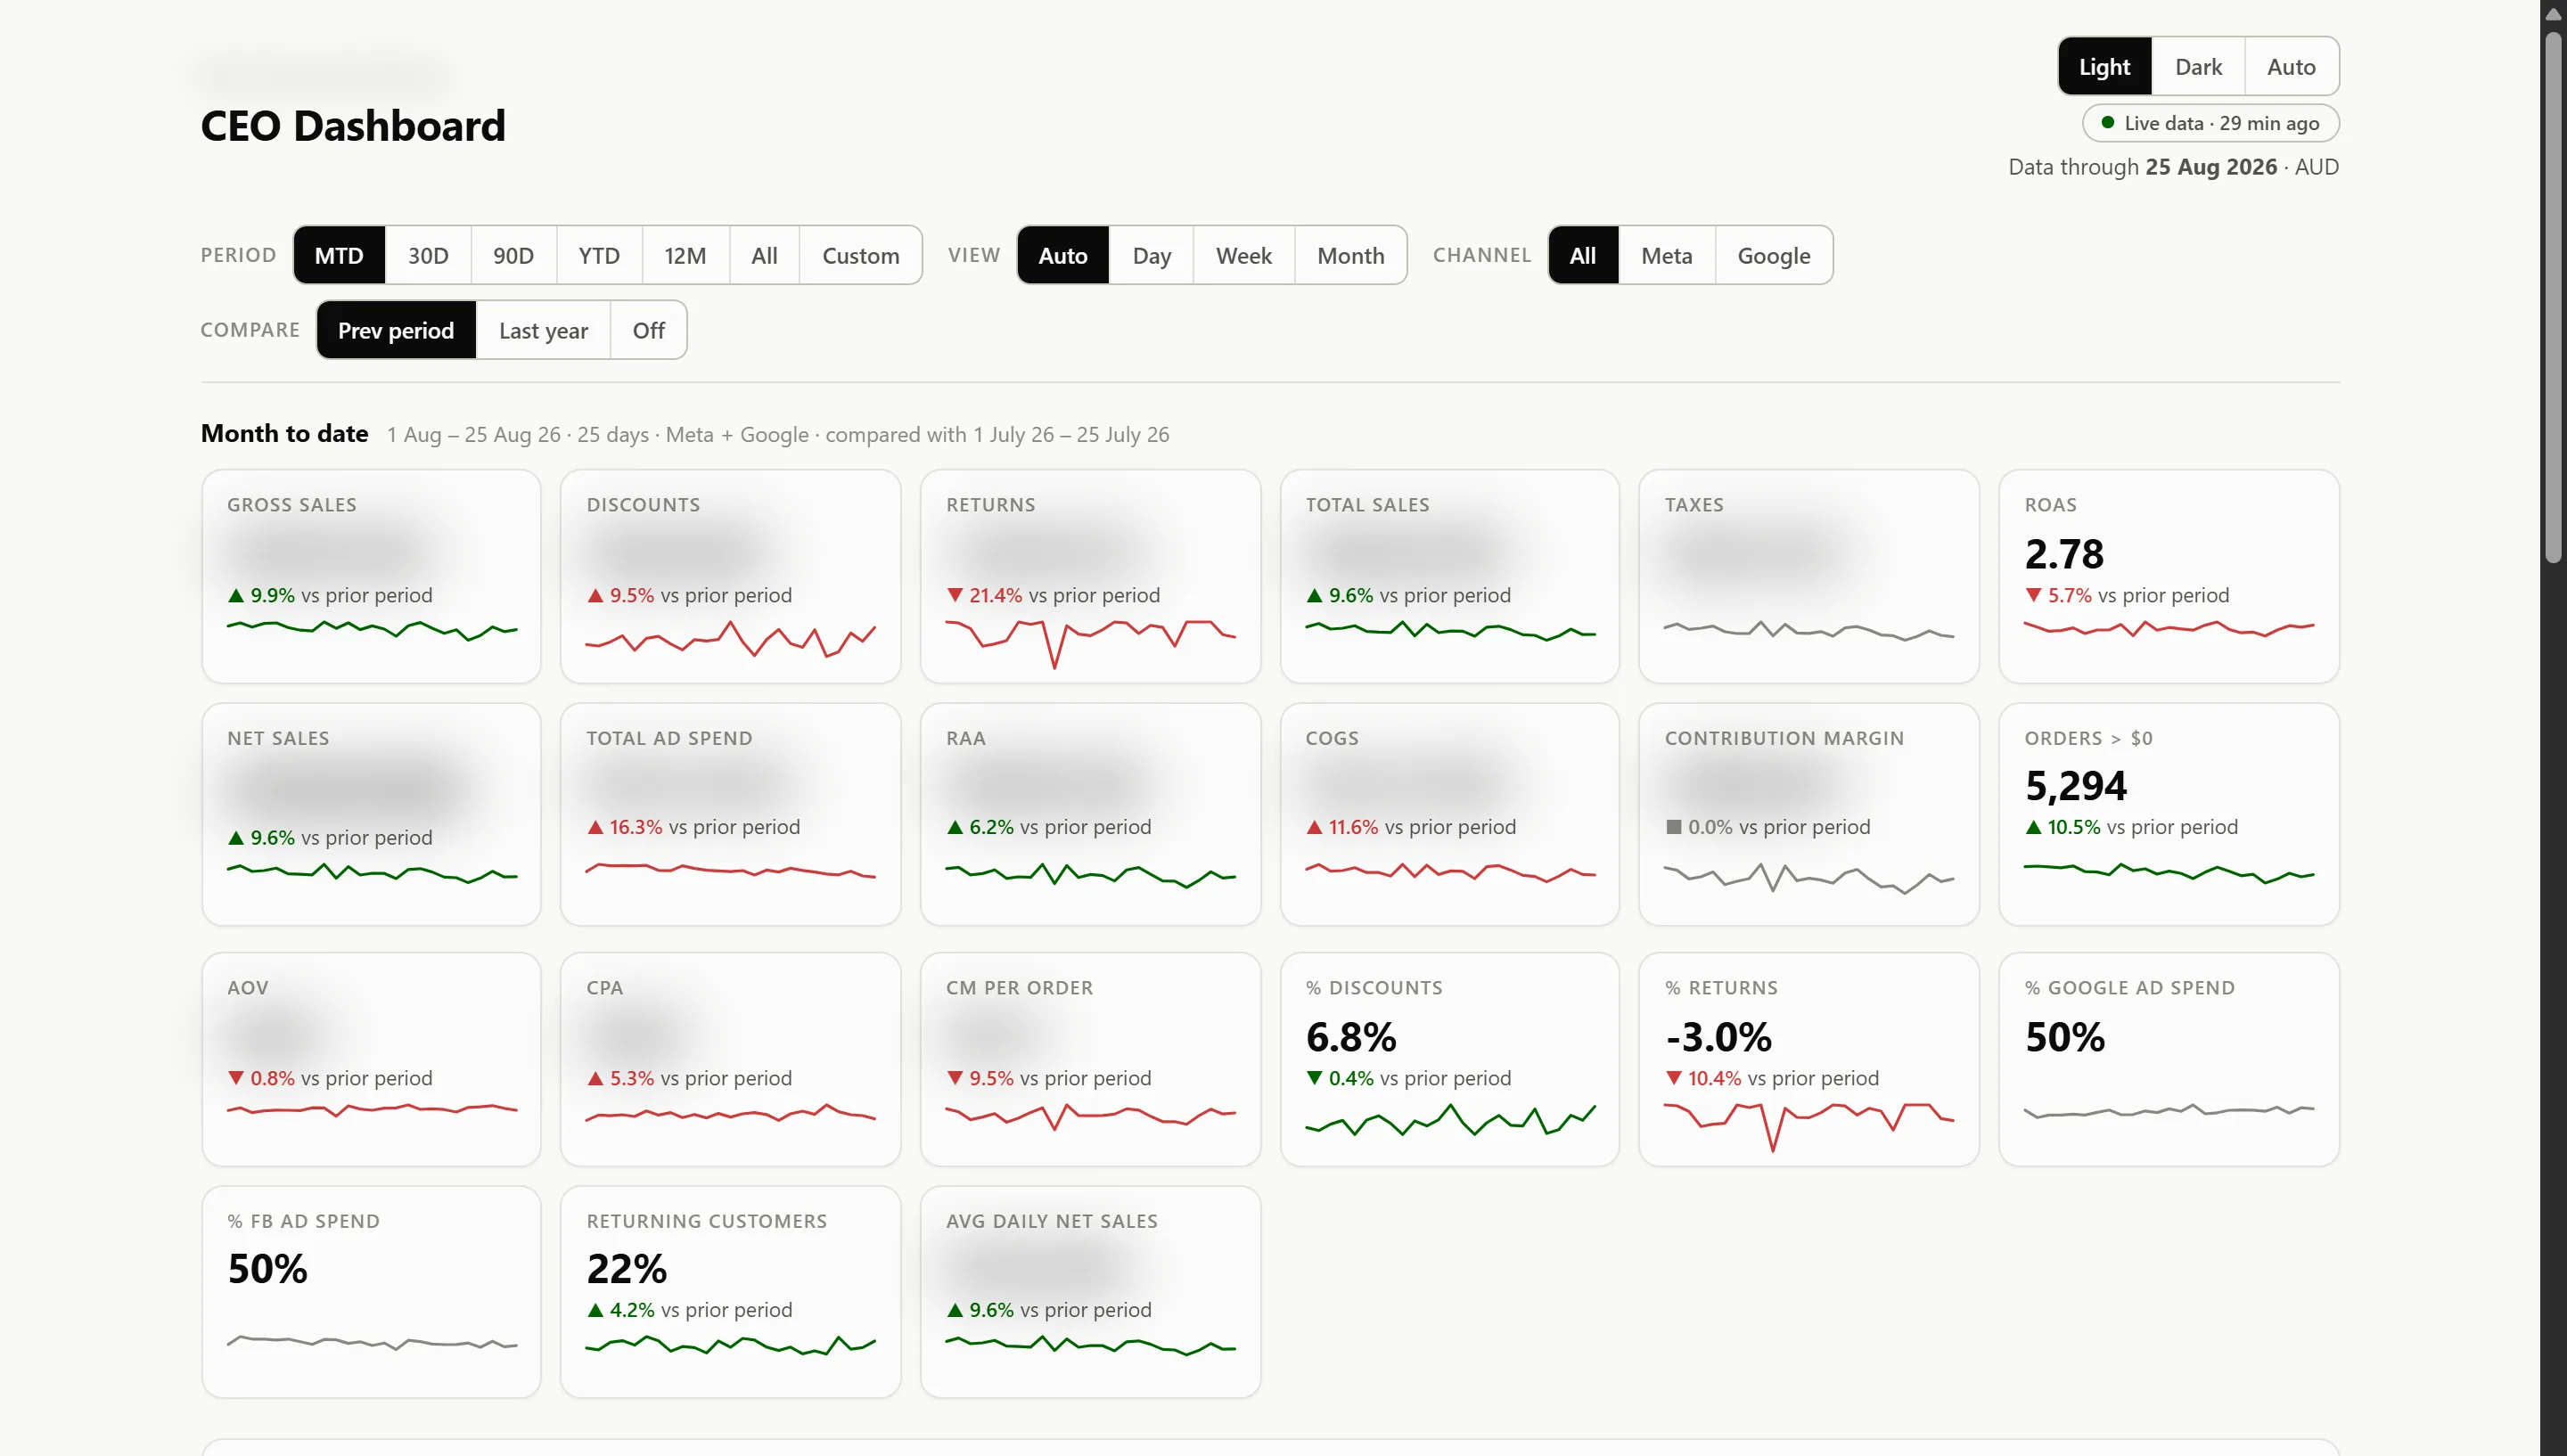
The founder used to build four reports by hand every morning. Now one dashboard answers the only questions that matter. Are we ahead of last month, and what should we change? It reads sixty-nine months of the client's own data, reconciled to the cent, and it replaced a rented tool whose numbers never added up.

The cover of the CEO Dashboard System walkthrough. A dark title panel on the left reads INSIDE DASHBOARDLIM above CEO DASHBOARD SYSTEM and AI-Powered Profitability Reporting; a presenter speaks to camera on the right; a video progress bar with a one minute one second running time sits across the bottom.
69months of history, reconciled to the cent2 hrsof manual reporting each morning, replaced
Profit dashboard

2026-08-25

Read the case study
Case Study

Operations

Field-Service Logistics Agent
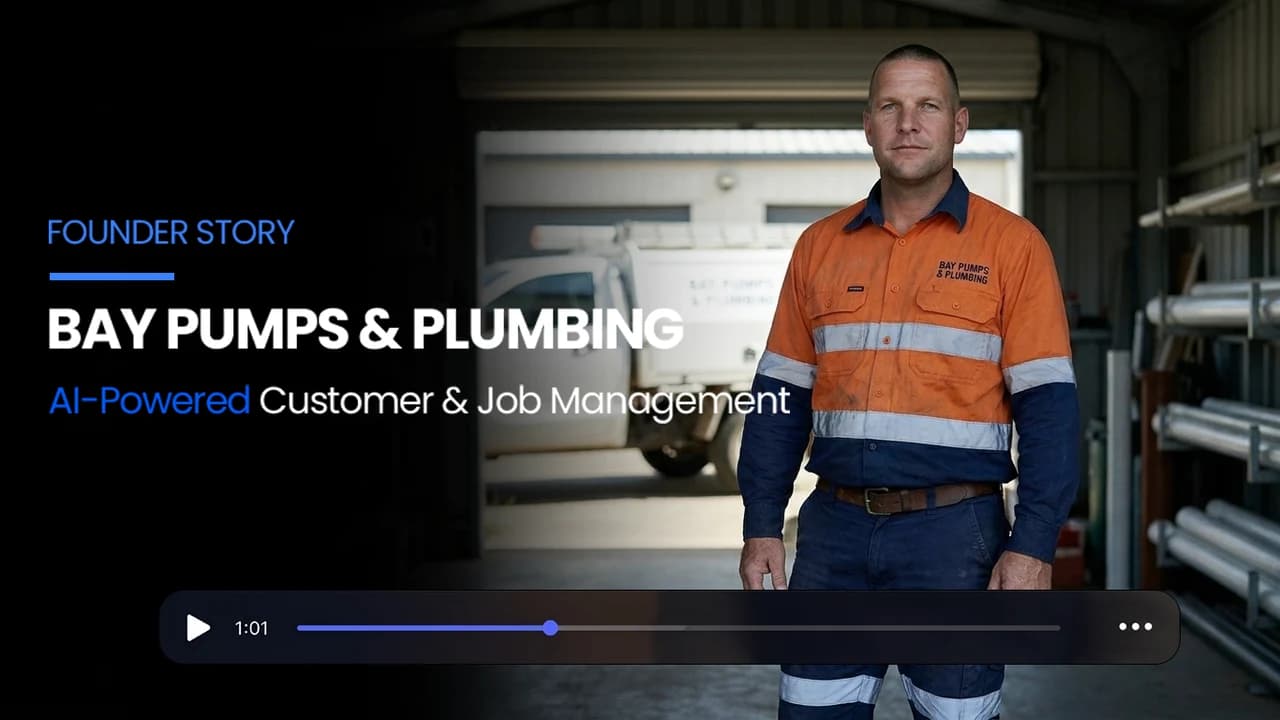
One van, one diary, and a service area 270 km across. Every day was worked out by hand after the last job. We built a scheduling agent that reads the job list, checks where the work actually is, and groups it into days that make sense to drive. Less admin, less driving, and time back on the tools.

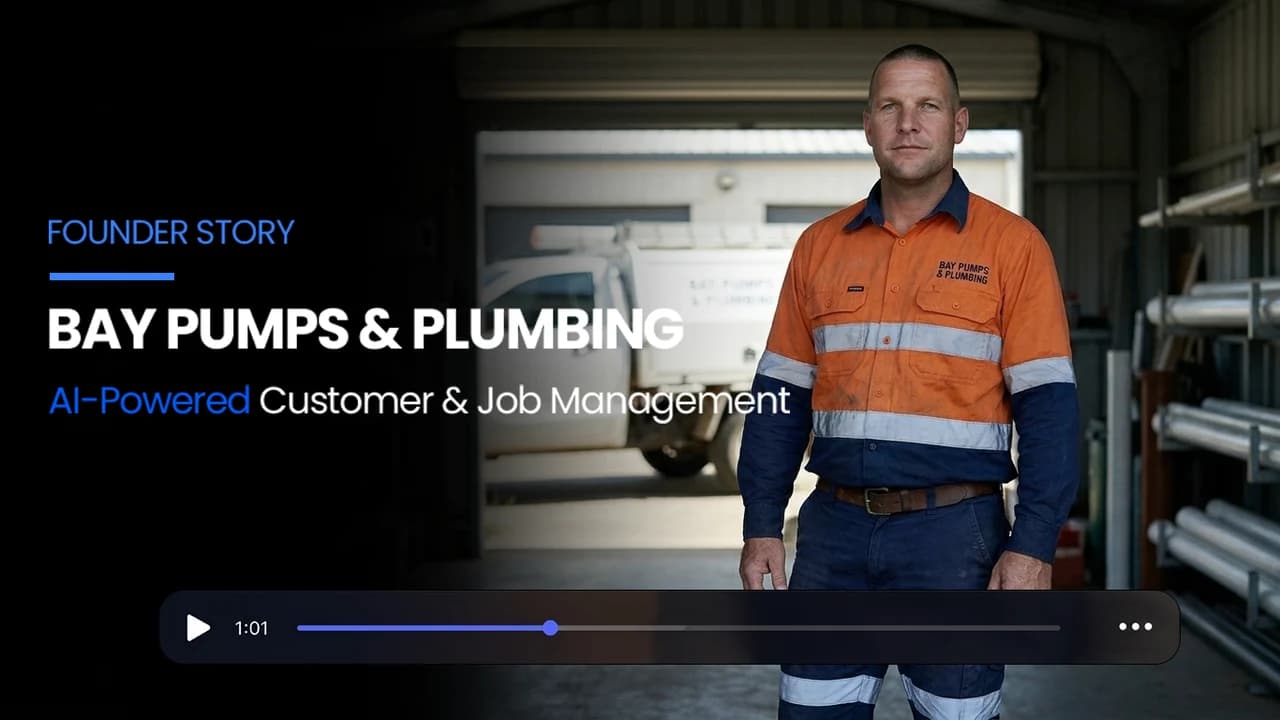
Founder-story poster for an Australian field-service business: the owner in high-visibility workwear outside the van bay, titled AI-Powered Customer and Job Management.
176jobs in one shared job list102suburbs the planner can route to
Field-service scheduling

2026-08-22

Read the case study
Case Study

Marketing

SEO + AI answers: product pages rebuilt, tested, then shipped
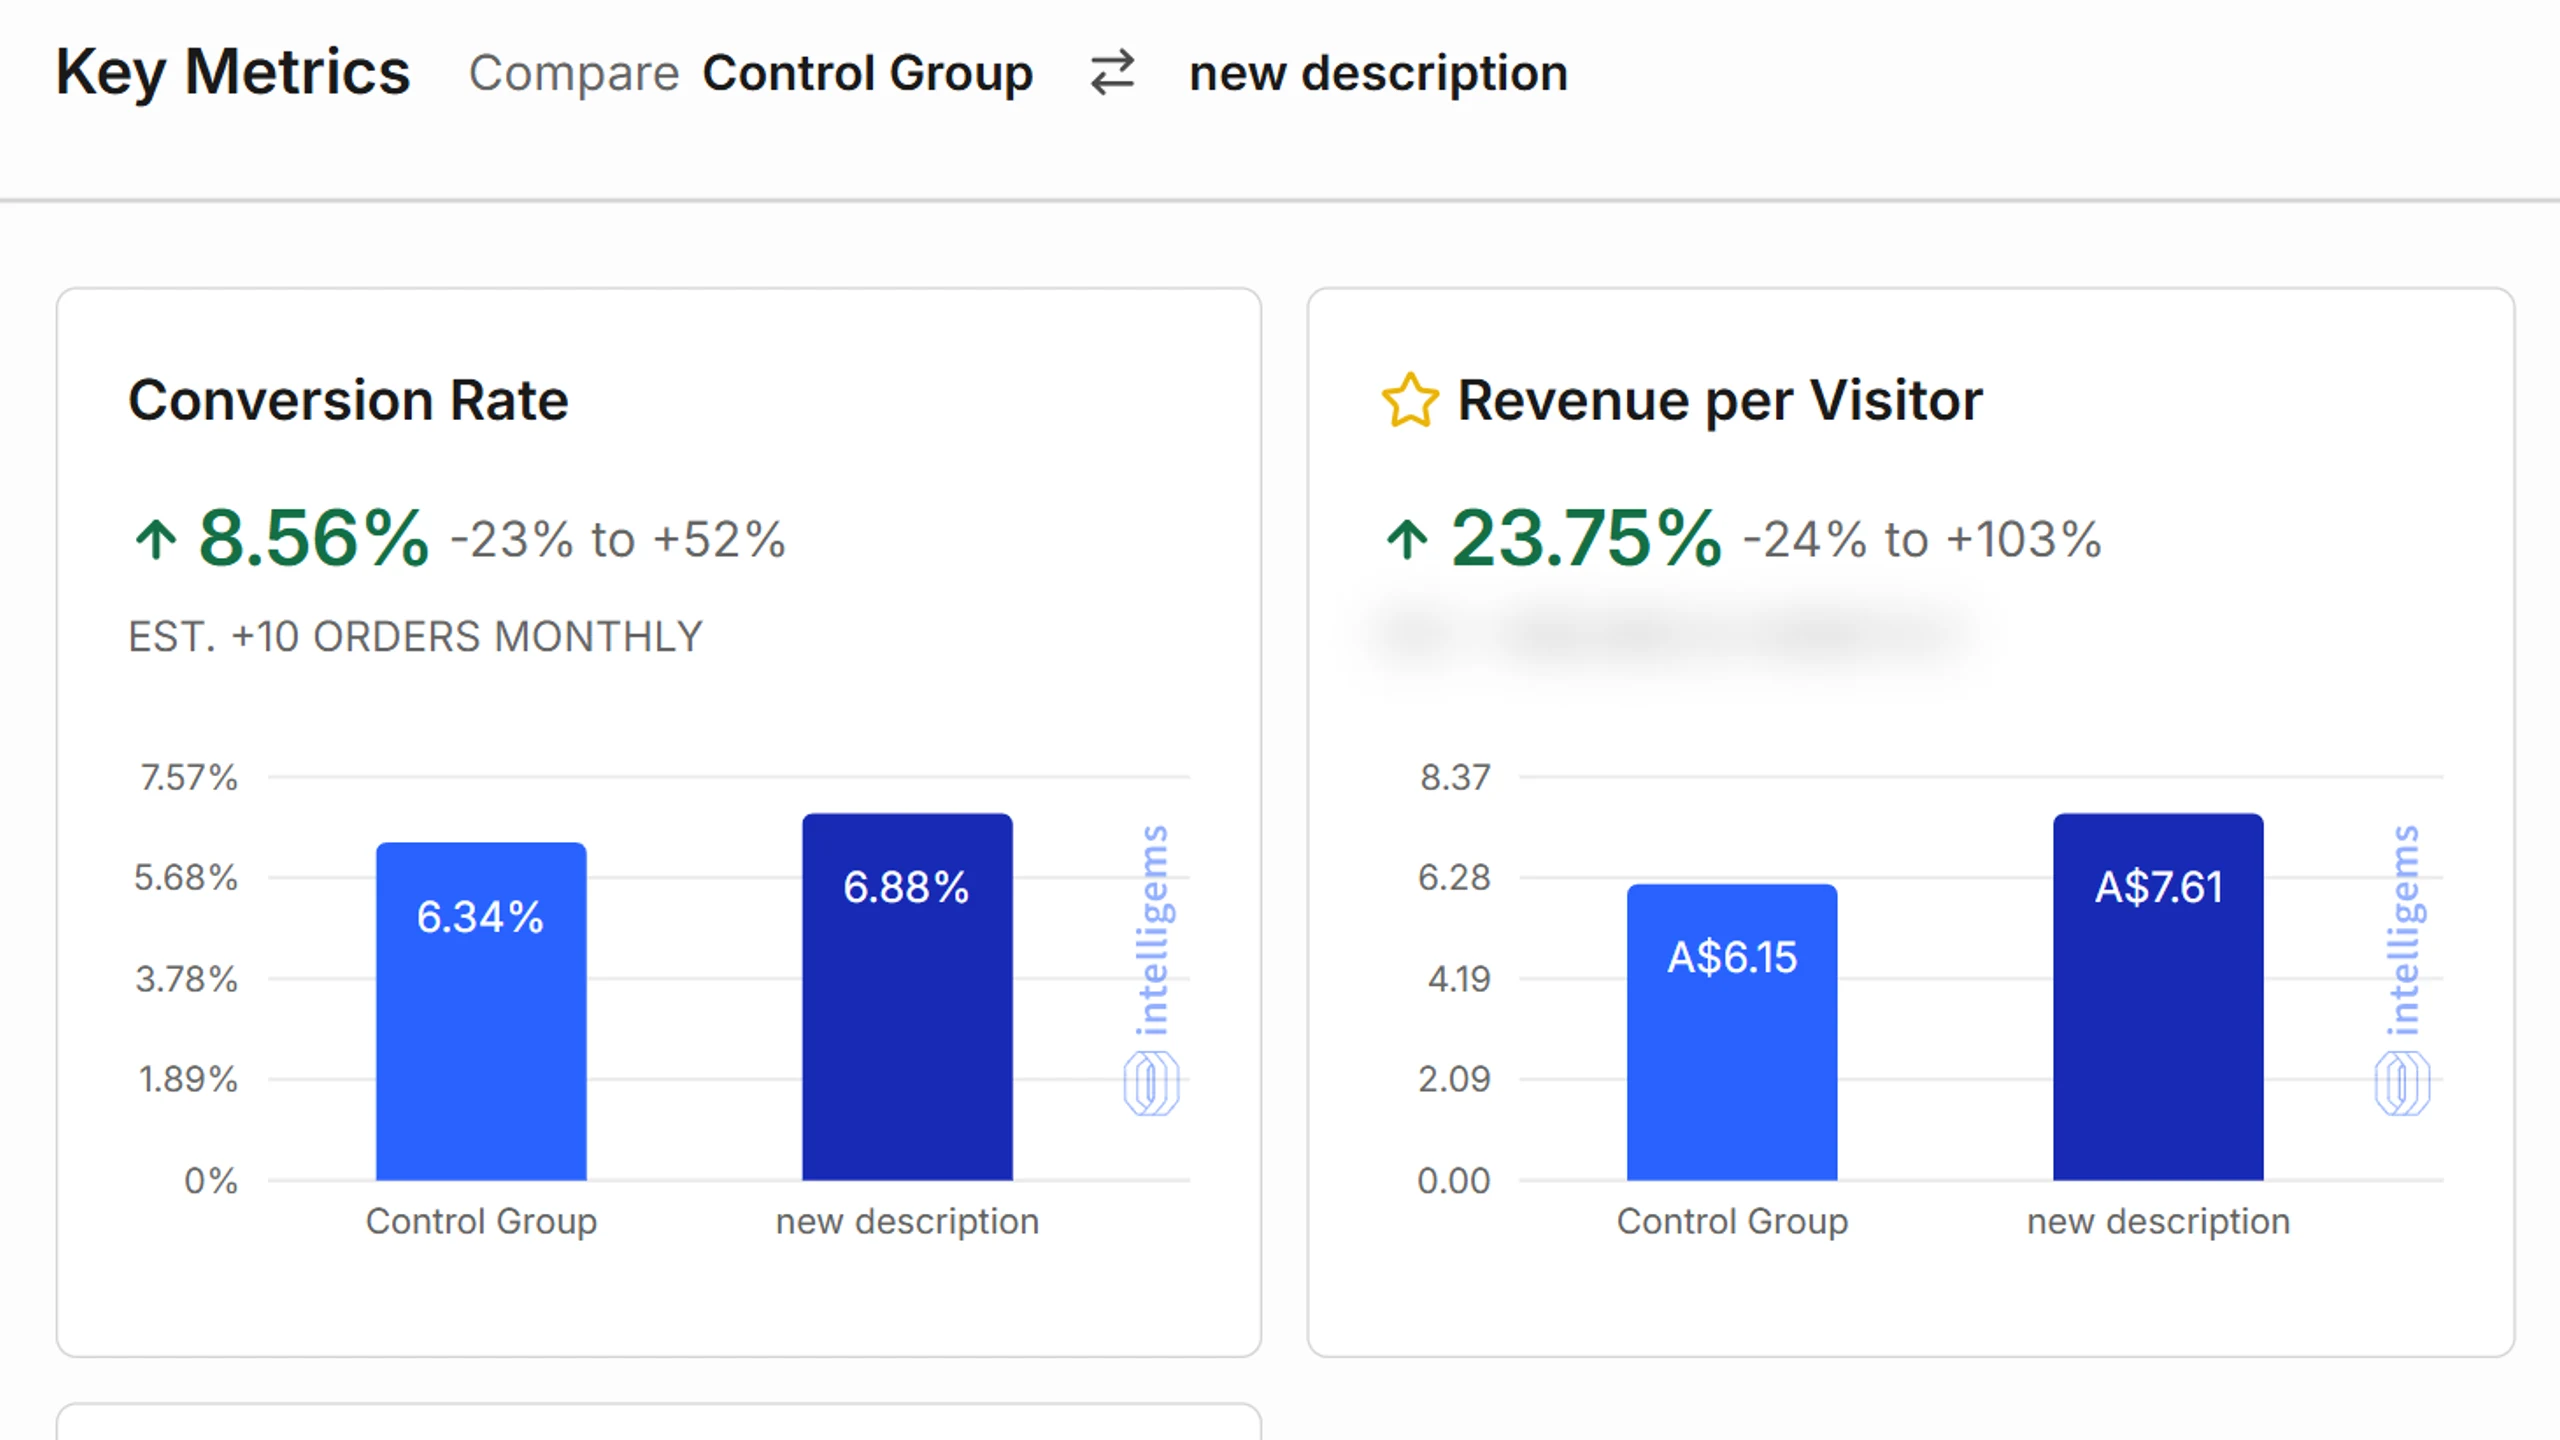
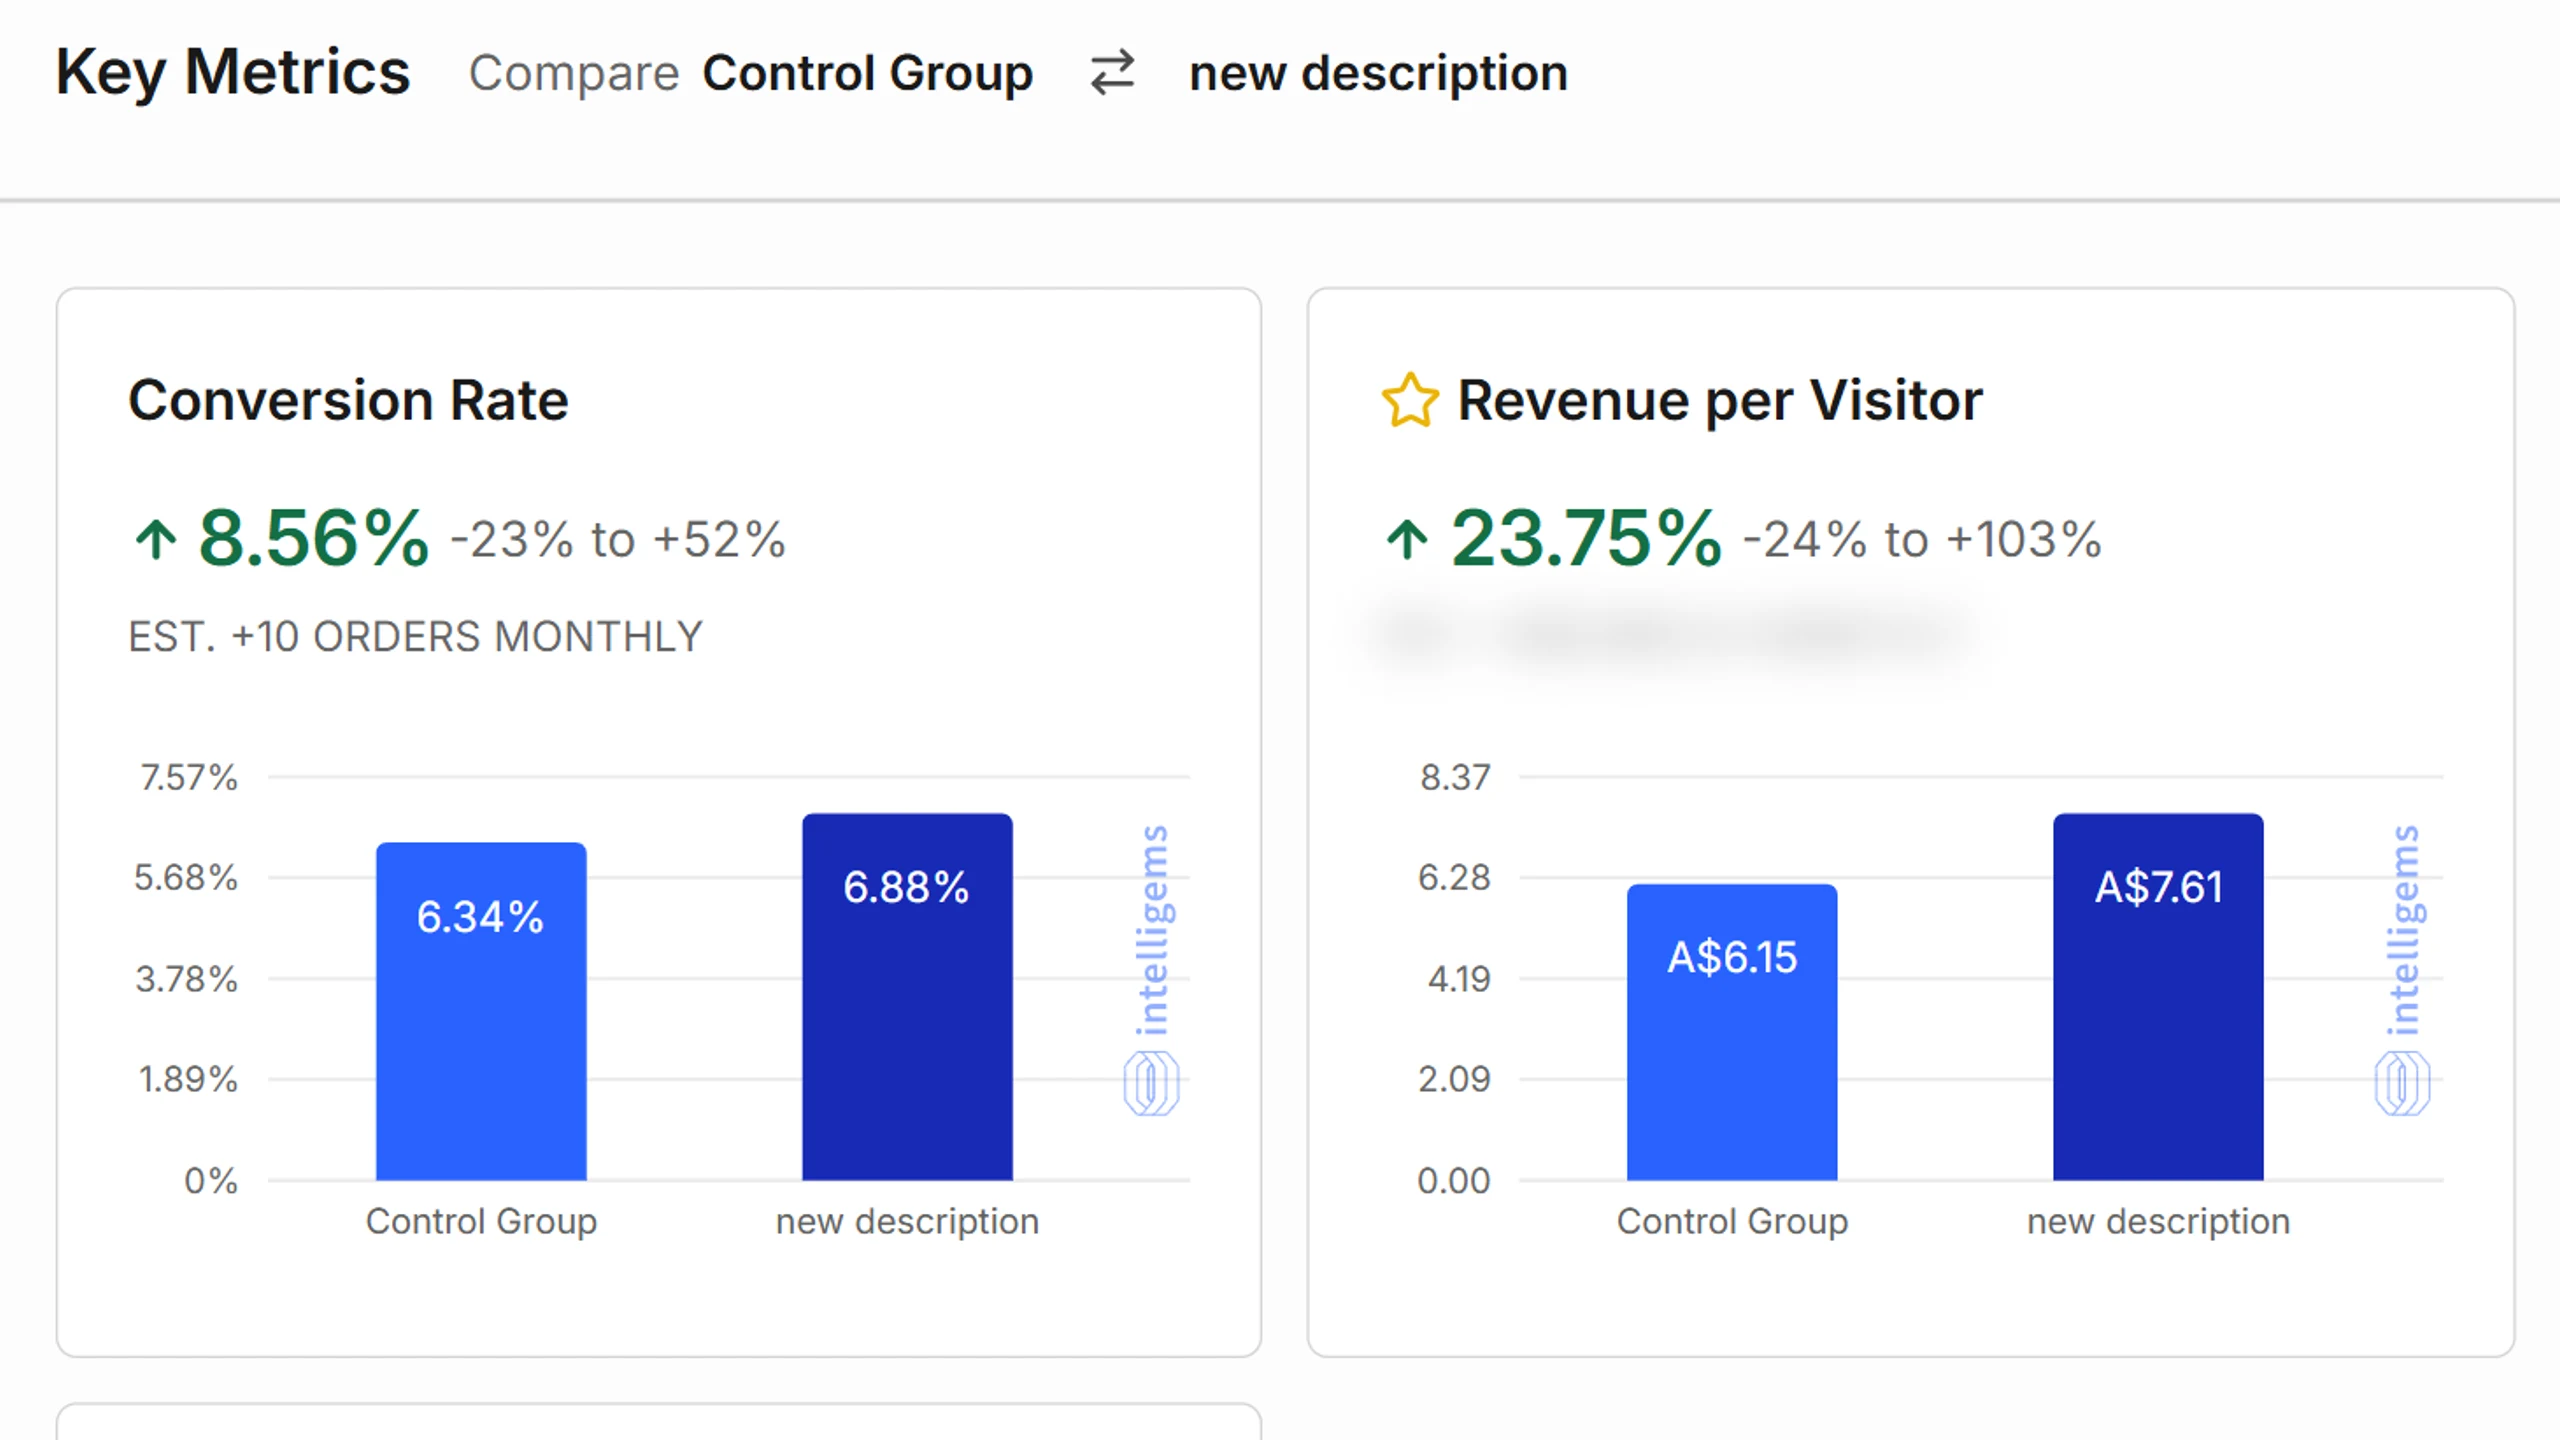
Hundreds of product pages needed rewriting for Google and AI search. We rebuilt them, then put the new pages against the old ones on live traffic. The rewritten pet bed page earned 23.75% more revenue per visitor across its full test before it was allowed to go live.

The live testing platform comparing the rewritten product page against the old one: conversion rate up 8.56% and revenue per visitor up 23.75%, with the control and new description bars side by side.
+23.75%revenue per visitor, rewritten pet bed page vs the old one, live split test+13.99%average order value in the same test
SEO + AI answer content

2026-08-21

Read the case study

Get the DashboardLim Brief

Real systems we've shipped, and the practical AI lessons from building them. Every library addition ships through the Brief first.


Written for operators, drawn from systems we actually shipped. Archived here in full.