Case study · Inventory dashboard · Reporting
Inventory Forecast Dashboard
A spreadsheet that knows what happens next. Shopify sales sync in overnight, the tracker separates what actually happened from what it expects, and cover days flag a stock problem weeks before it reaches the warehouse.
A multi-region golf equipment retailer
12-week forward view
Every reorder call stays human
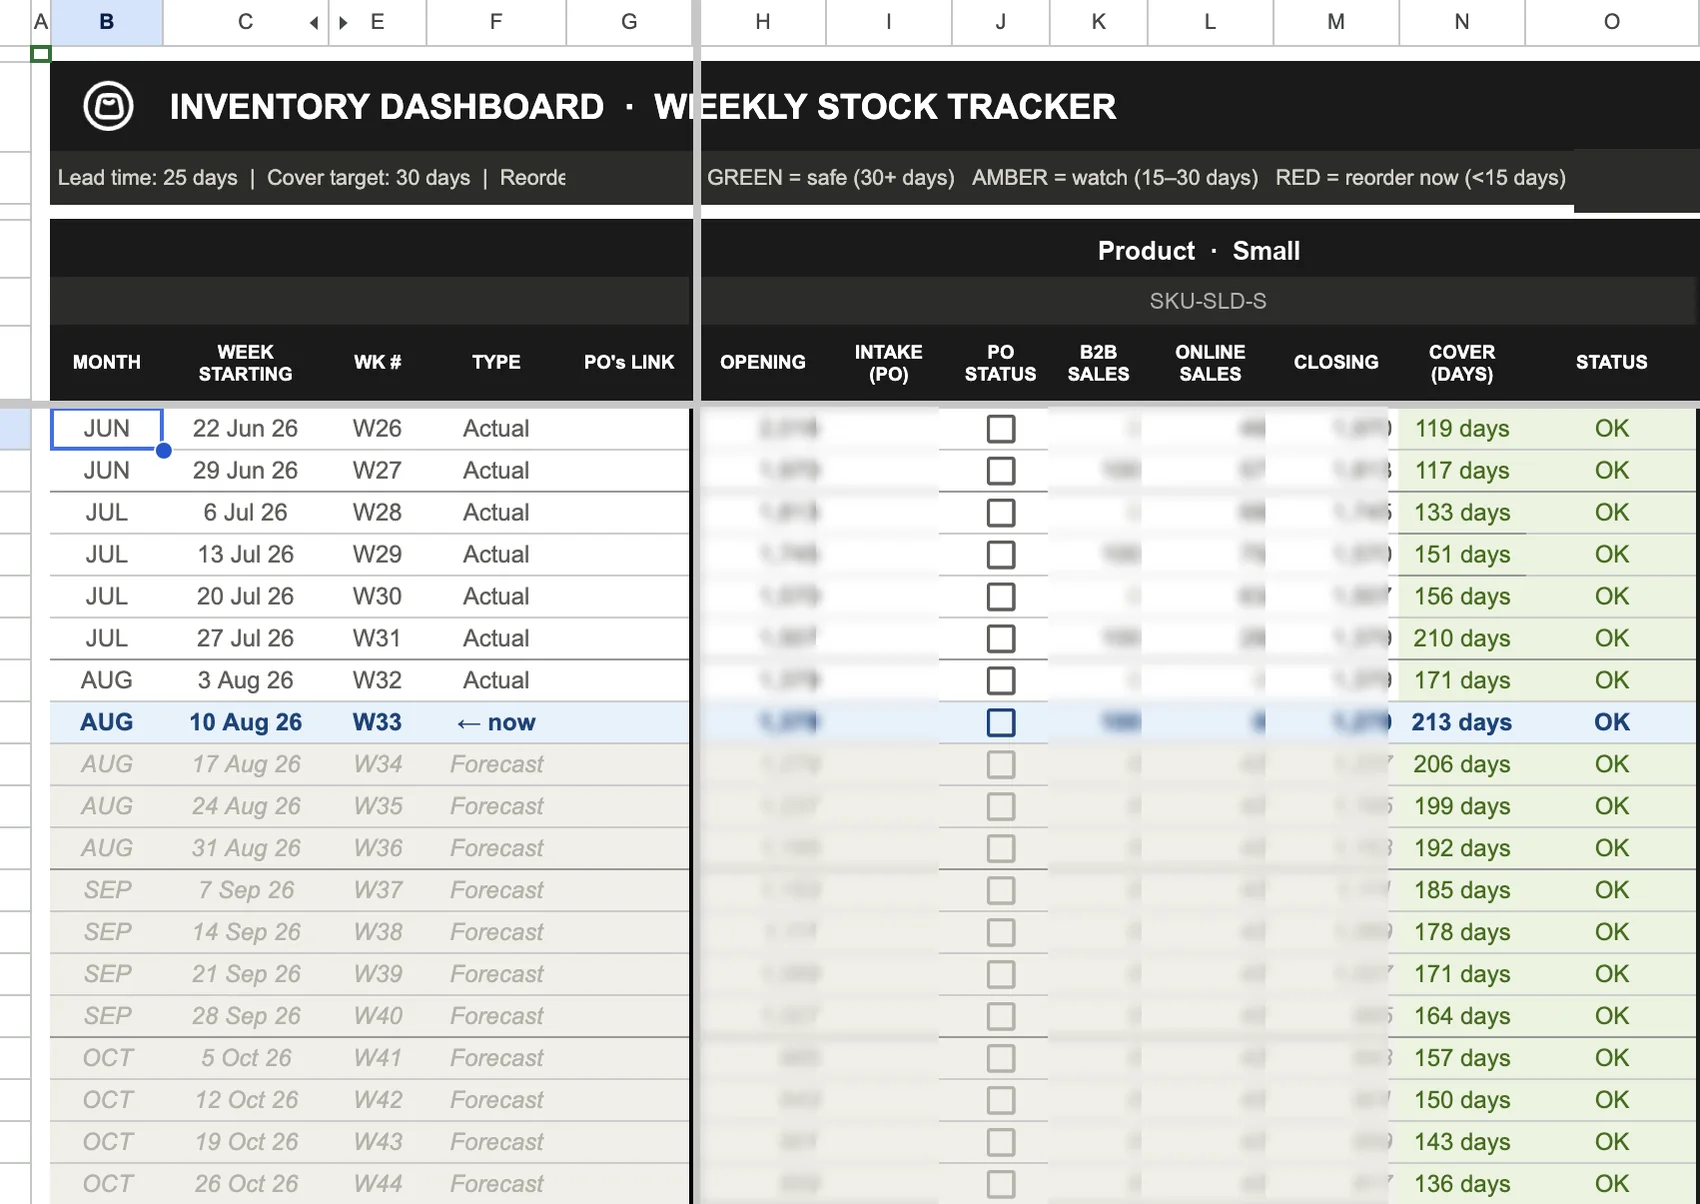
Weekly stock tracker
Past actuals, the current week and the forward inventory picture, in one view.
1 / 5
Screenshot of the running system. Product and SKU names replaced; opening, intake, sales and closing quantities blurred. Dates, week numbers, row types, cover days and statuses are untouched.
Nightly
Shopify sales and fulfilment sync
12 weeks
of cover projected forward
2 regions
separate 3PLs, tracked independently
Every Monday
the report posts itself into Slack
See the inventory system working end to end
A short walkthrough of the live sheet: how actual weeks roll into forecast weeks, how cover days and inbound purchase orders change the signal, and how Shopify data reaches the team through n8n and Slack.
Founder walkthrough of the live system, from the nightly Shopify sync to the forecast logic, purchase-order context and weekly Slack reporting.
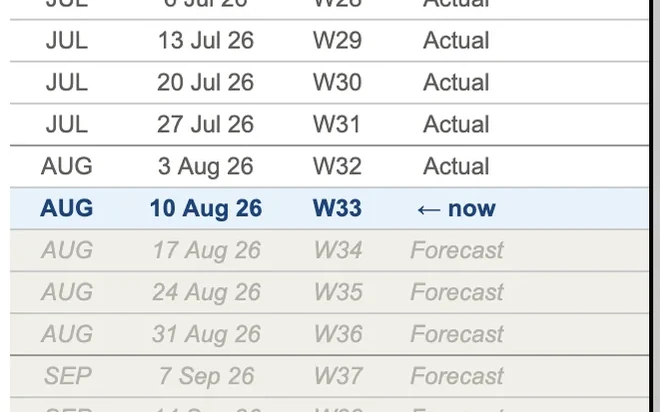
The tracker knows which week it is
One row per week, oldest at the top, scrolling down into the future. What the system adds to a familiar layout is a sense of time.
Low stock is not automatically an emergency
Cover days alone would cry wolf. The tracker also reads the intake lane, so the same low number means different things depending on what is already on the way.
“If I have a stock order coming in, it shouldn't be red. At the moment your formula is not looking at the intake lane.”
Weekly stock tracker · purchase-order states across two products
Product and SKU names replaced; stock, intake and sales quantities blurred. The colour rules, purchase-order states, checkboxes and cover days are exactly as the team sees them.
The rules sit on the sheet
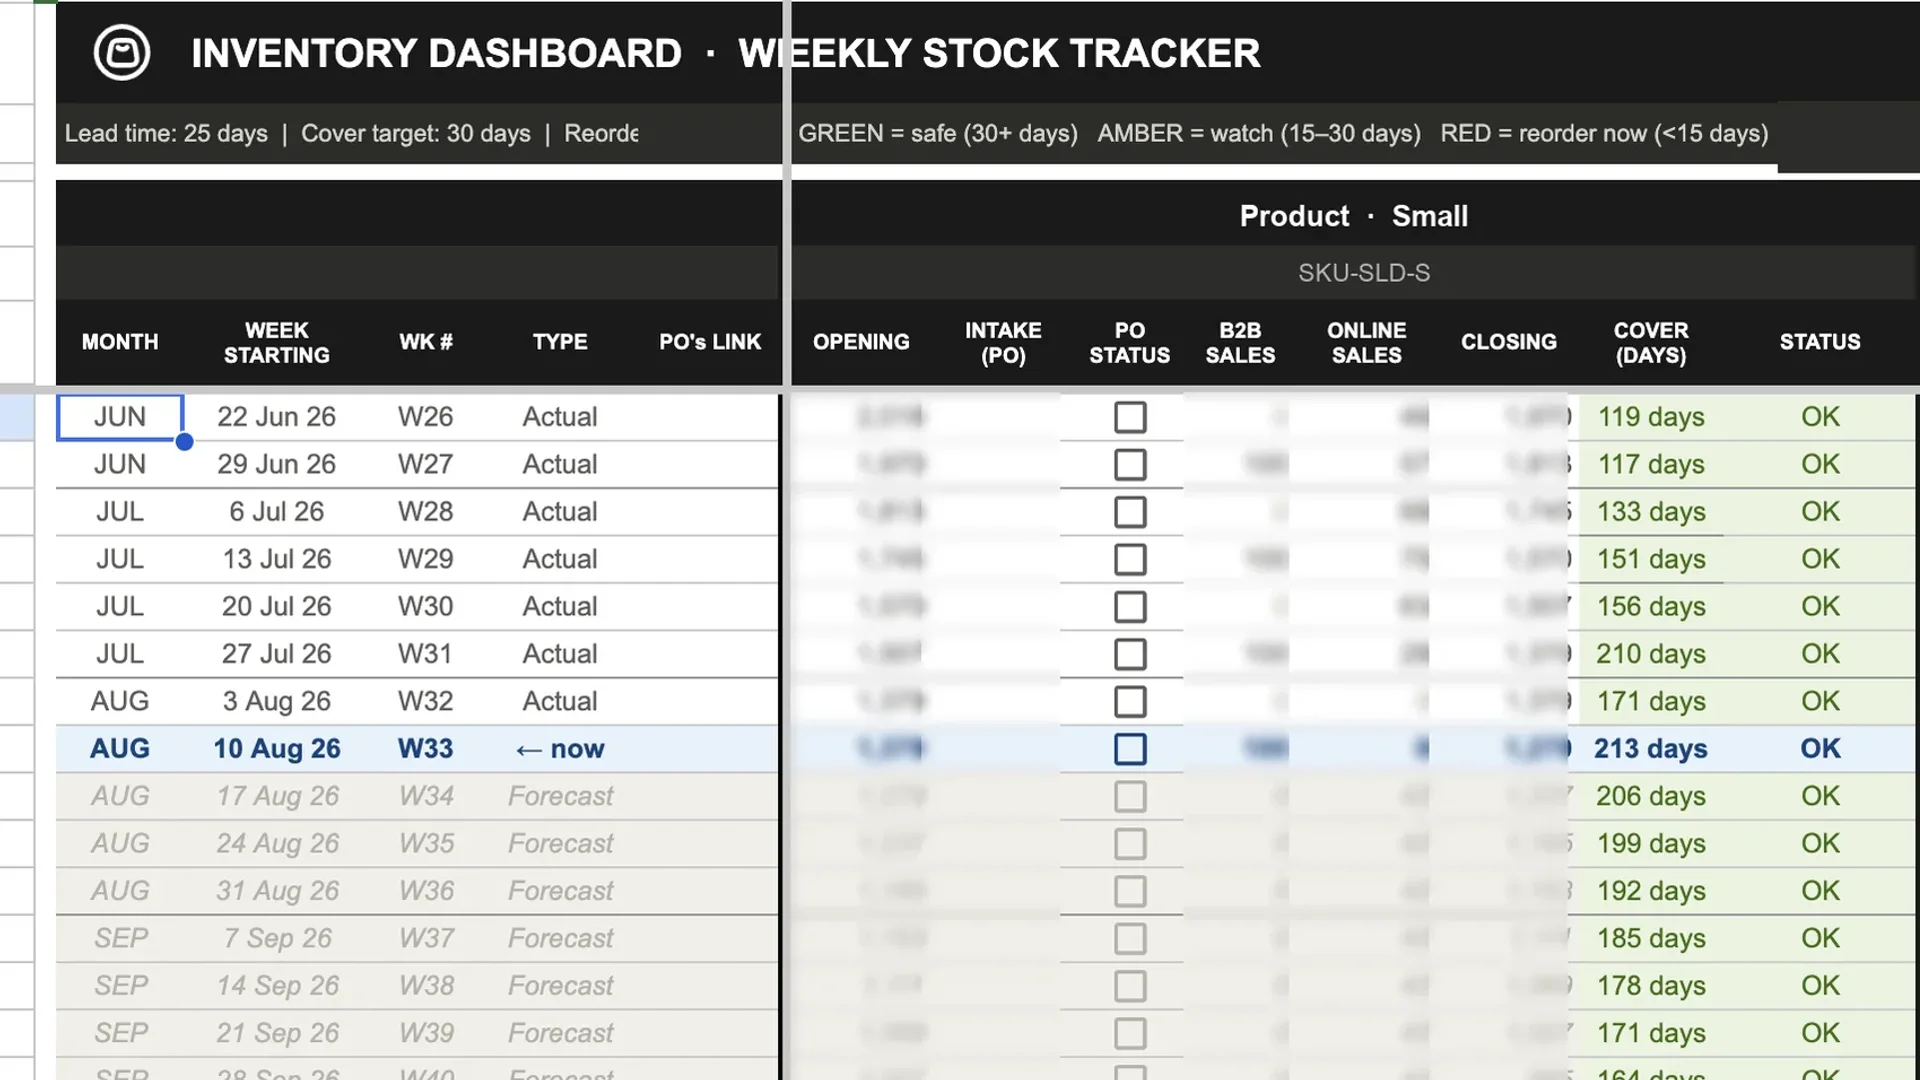
Lead time, cover target and what each colour means are written across the top, so the tracker can be read without being taught.
A revenue target, turned into a reorder plan
The planner runs the founder's question in reverse: type next month's revenue target and it works down to the quantity to order and the date to order it.
“I want to plug in — I want to make a certain amount next month. If I do, how many units should I be selling every week? And based on that, my inventory forecast is matched up to my revenue goals.”
Forecast Planner · the live client sheet
SKU codes replaced; sell prices, stock levels, order quantities and the revenue target blurred. The size split, cover, lead time, order-by dates and statuses are untouched.
Target in, units out
The monthly target is divided by the weeks in the month and the size split, giving the units each variant has to sell.
The report comes to you
A dashboard only works if someone opens it. This one posts itself into the channel the team is already in.
Slack · the report as it arrives, posted by the reporting app
SKU codes replaced and fulfilment partners shown as their region; unit volumes blurred. Dates, structure and every week-over-week figure are untouched.
One row per SKU and region
The same size appears twice when it ships from two places, so a region running short cannot hide behind the other.
Four weeks, week over week
Enough to see a trend forming, with the change called out per line and across the catalogue.
How it is wired
Four tools the team already pays for, and one person who still decides.
Shopify
What sold, and from where
- Orders
- Refunds
- Fulfilment location
What runs itself, what stays human, what we can add
The first column is what this build does today. The third is not a roadmap — it is what we can ship when a client asks for it, and none of it is running here.
Runs itself
This build
Nightly Shopify sales and fulfilment sync
Region split from the fulfilment location
Cover days, statuses and the forward projection
The weekly inventory report into Slack
You decide
Deliberately human
Stock counts and purchase-order entries
Wholesale sales, invoiced outside Shopify
The arithmetic is automated. The buying is not.
Nothing here places an order, contacts a supplier or moves stock. The system assembles the picture and does the maths; a person still decides what to buy and when.
There is no predictive model and no AI in this build, and we are not going to call it one. The forecast is arithmetic on real sales, configured lead times and a revenue target you set — every assumption visible on the sheet, every number traceable to a row. That is also why it can be trusted with a buying decision.
No purchase order is placed without a person
The sync writes raw sales rows only — manual corrections survive it
Forecast rows are labelled as forecast, never mixed into the record
What it changed
Monday stopped being assembly day The week starts with a tracker that has already updated itself, instead of an export waiting to be rebuilt.
Stock risk shows up early Cover days run twelve weeks ahead, so the week stock runs short is visible now rather than on the day it happens.
Red means something again A confirmed order changes the state, so an alarm is worth reacting to instead of worth ignoring.
One file answers several questions The weekly tracker, the revenue-to-units planner and the month-end stock value live in the same sheet — no extra platform, no new subscription.
Related resources
Newsletter
Q2 roundup: what shipped, what it moved
The Q2 scoreboard this system appears in.
Read it →Case study
WHA Sales Performance Dashboard
We replaced scattered sales reporting with a single live sales performance dashboard — every deal, stage and automation signal in one screen, refreshed automatically every day.
Read it →Want a sheet that tells you when to reorder?
Tell us your catalogue size, your fulfilment regions and your supplier lead times, and we will show you what this looks like on your numbers.