Client system · Multi-client dashboards
One Operating View Per Client
Every client gets their own dashboard. All of them read the same warehouse, answer to the same controls, and reconcile to the ad platforms they came from.
Performance marketing agency
Six client dashboards
Meta · Google · TikTok · Reddit
One BigQuery warehouse
Per client access
Inside the system
Watch the system in action
See how one agency runs multiple client dashboards from one reporting layer.
1 / 5
Built on the platforms you already buy media on
You do not have one reporting problem. You have one per client.
Every client was reported out of one spreadsheet, fed by Supermetrics and rebuilt every month. One tab set per client.
It worked, and it did not scale. Clients spent up to half an hour reading a sheet and came away with little they could act on, and the sheet was the only place the history lived. Asking whether something was getting better or worse meant opening it again. Every time. For every client.
The unit of work
One client. One dashboard. One set of controls.
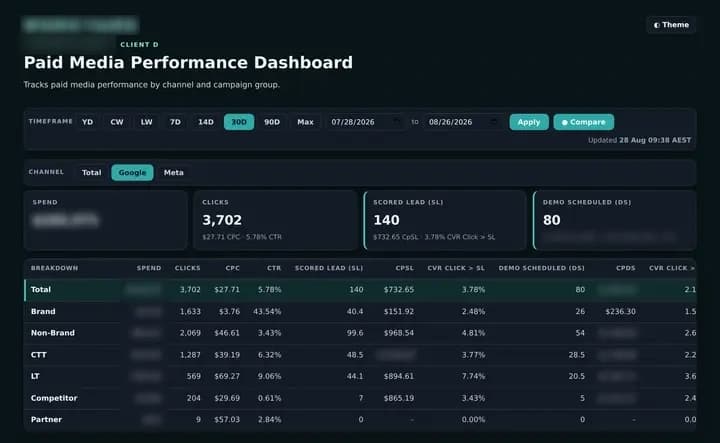
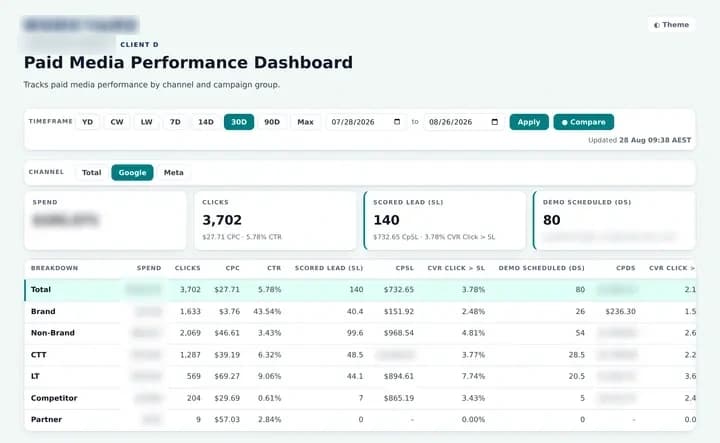
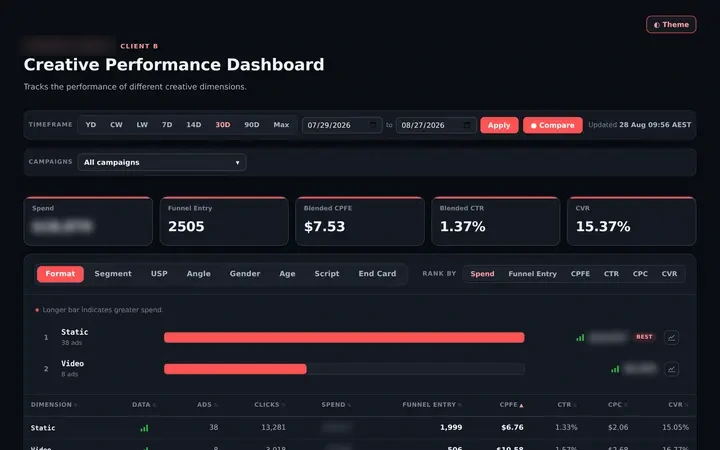
Each dashboard is built around how that client actually buys media. Market cohorts for one, creative dimensions for another, campaign groups for a third.
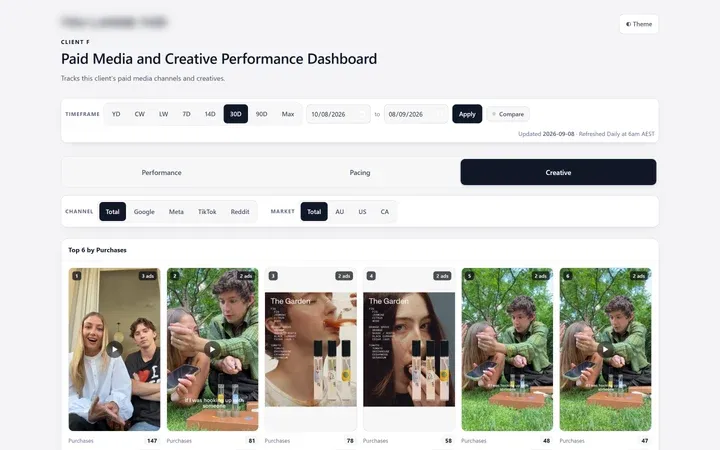
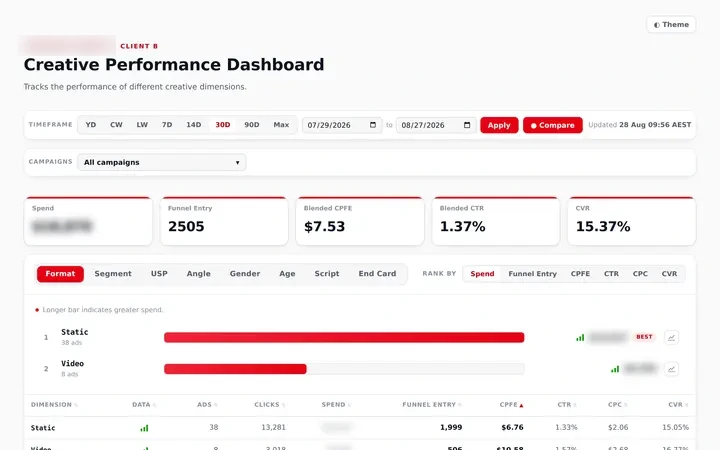
What never changes is the shell. The same timeframe row, the same compare toggle, the same filters in the same place. Learn the controls on one client and you can read all of them.
Control behaviour confirmed against the deployment note issued when the dashboards were brought into line.
The shared control shell above a client specific view.
The portfolio
Six clients, one place to stand
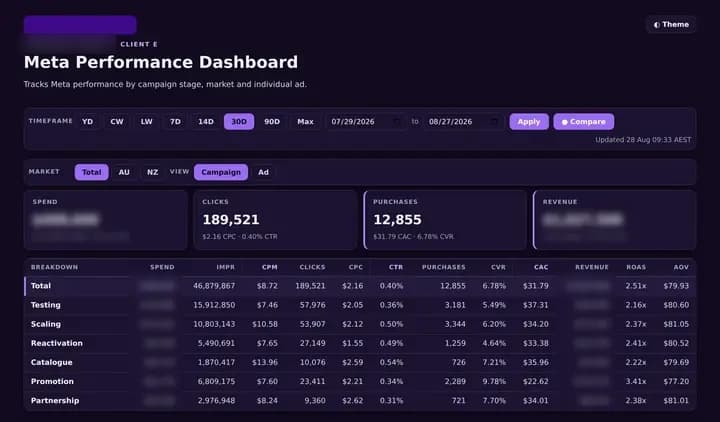
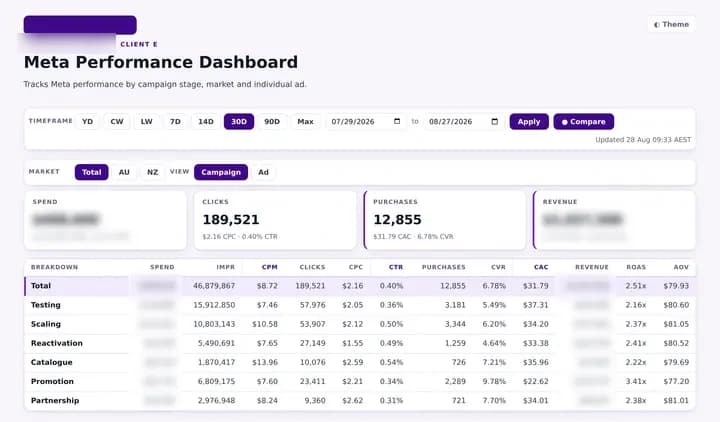
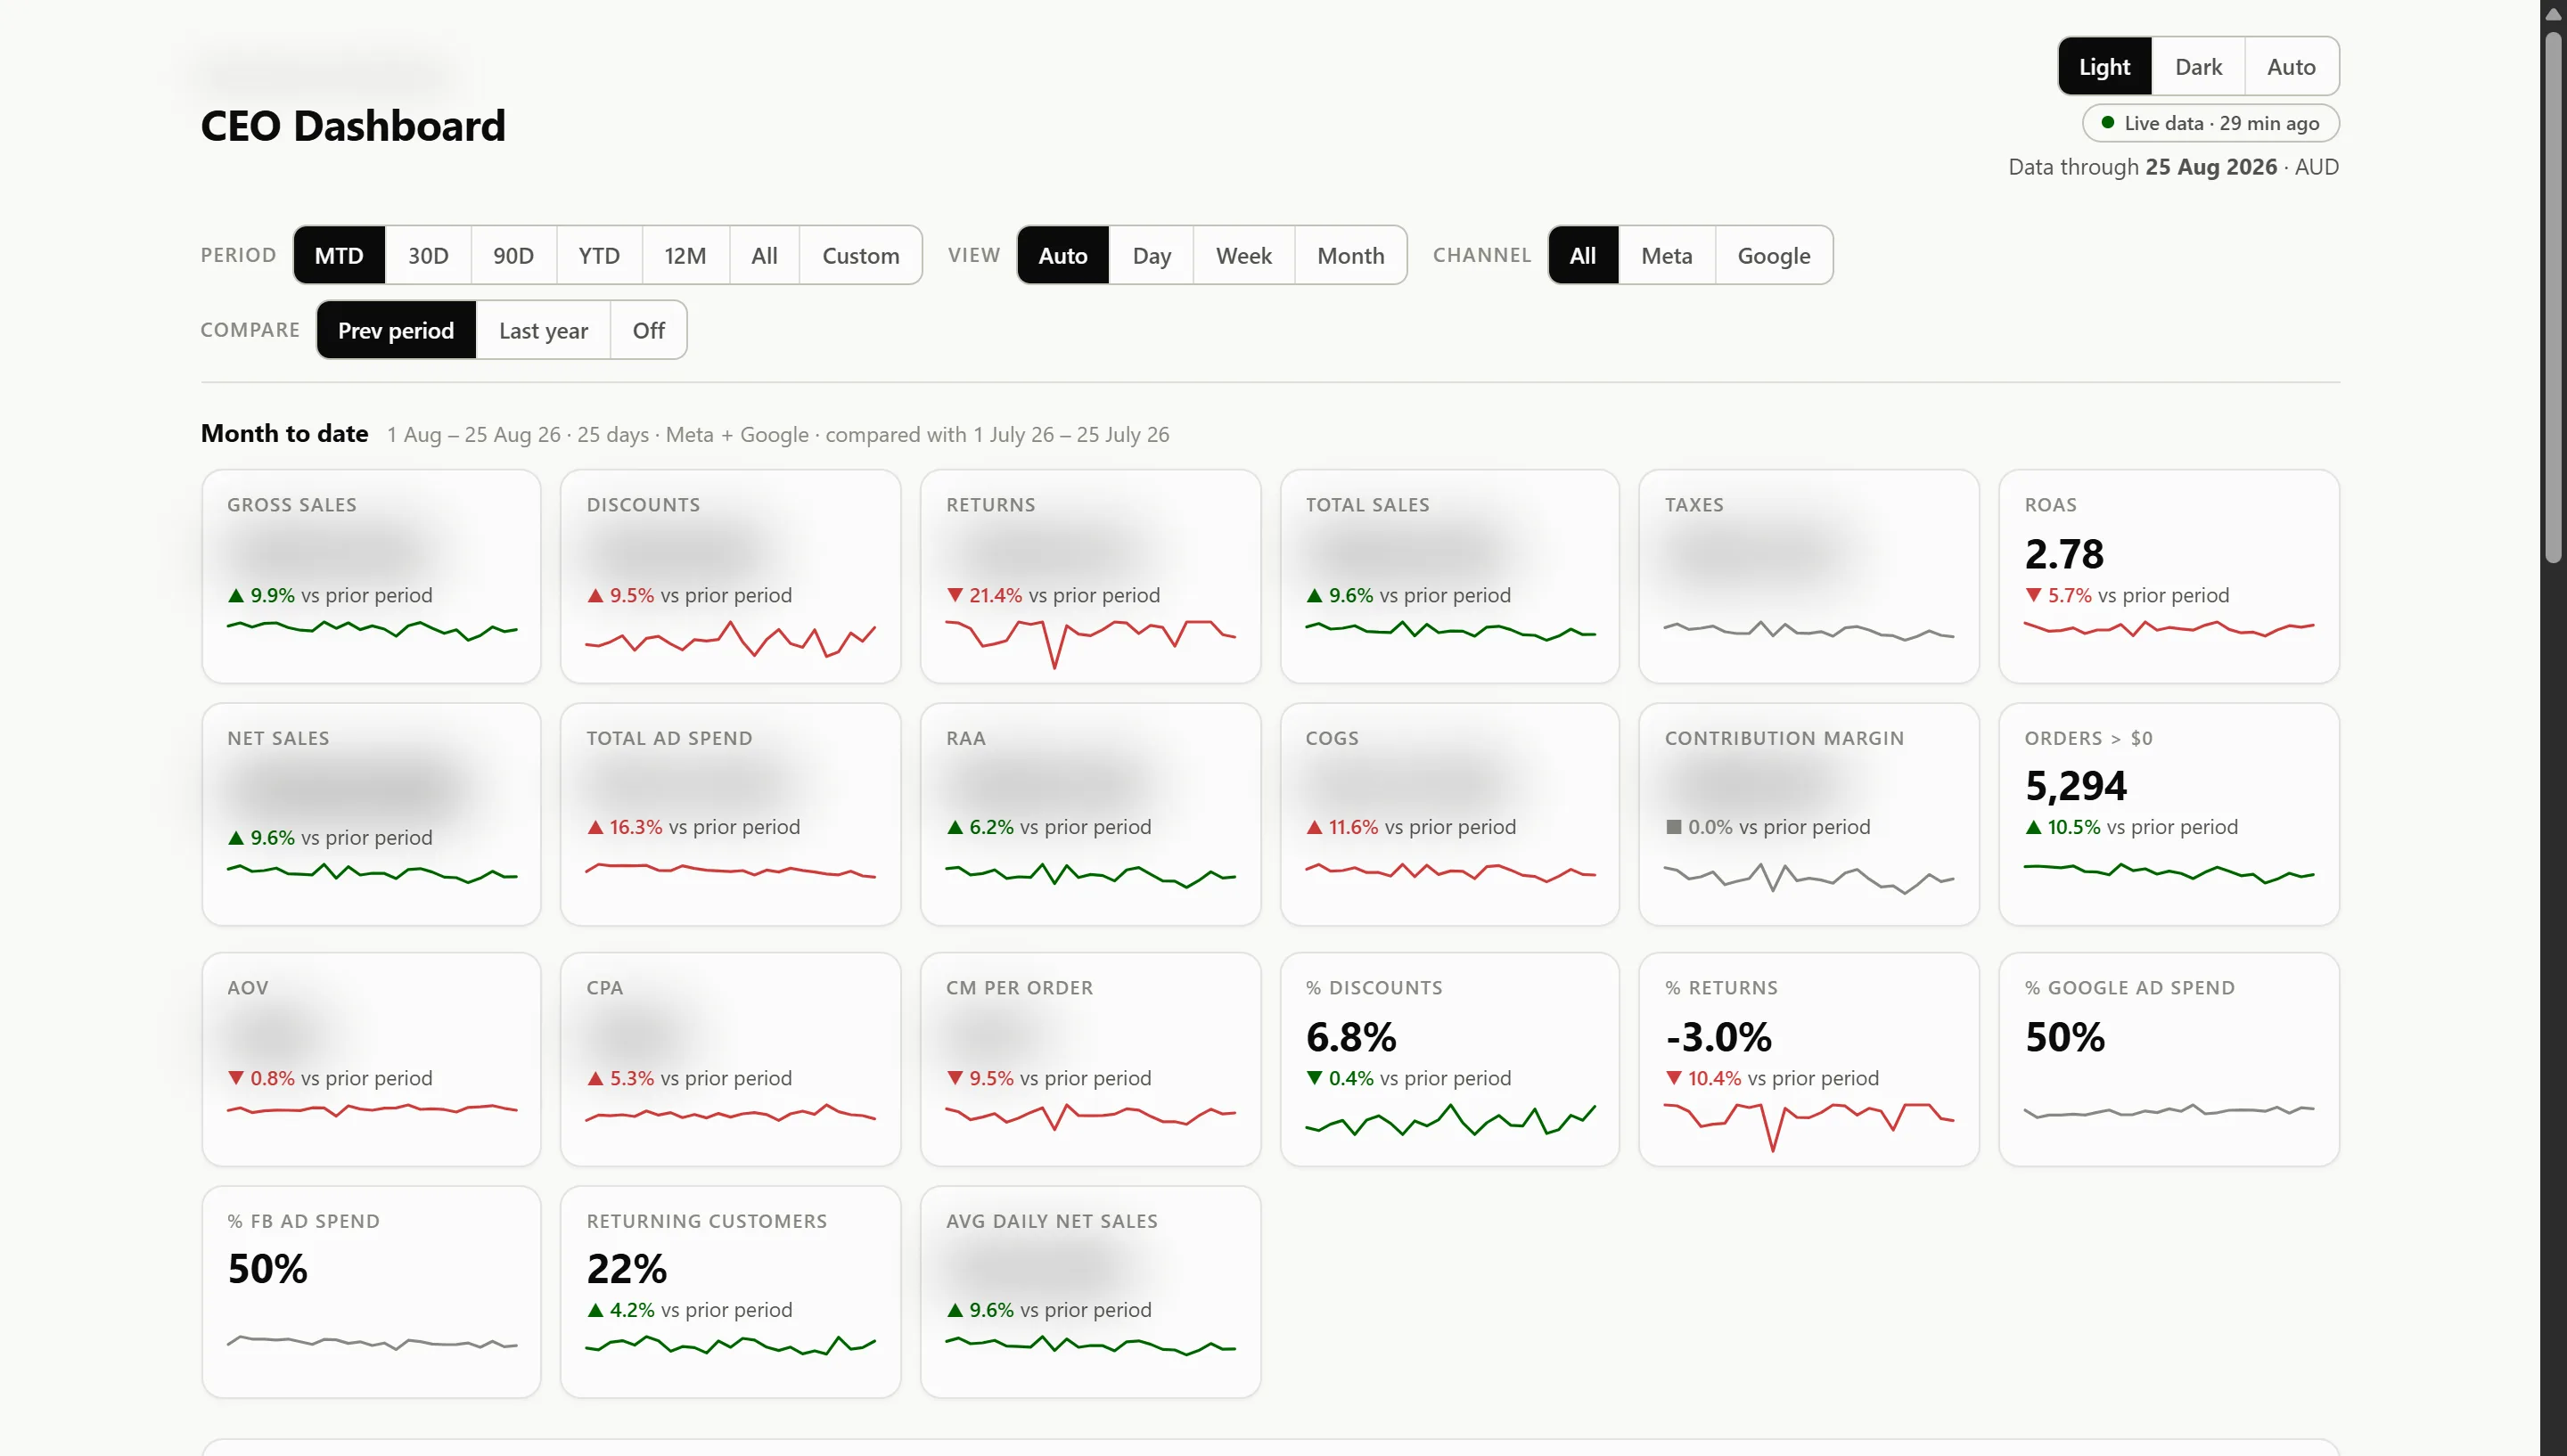
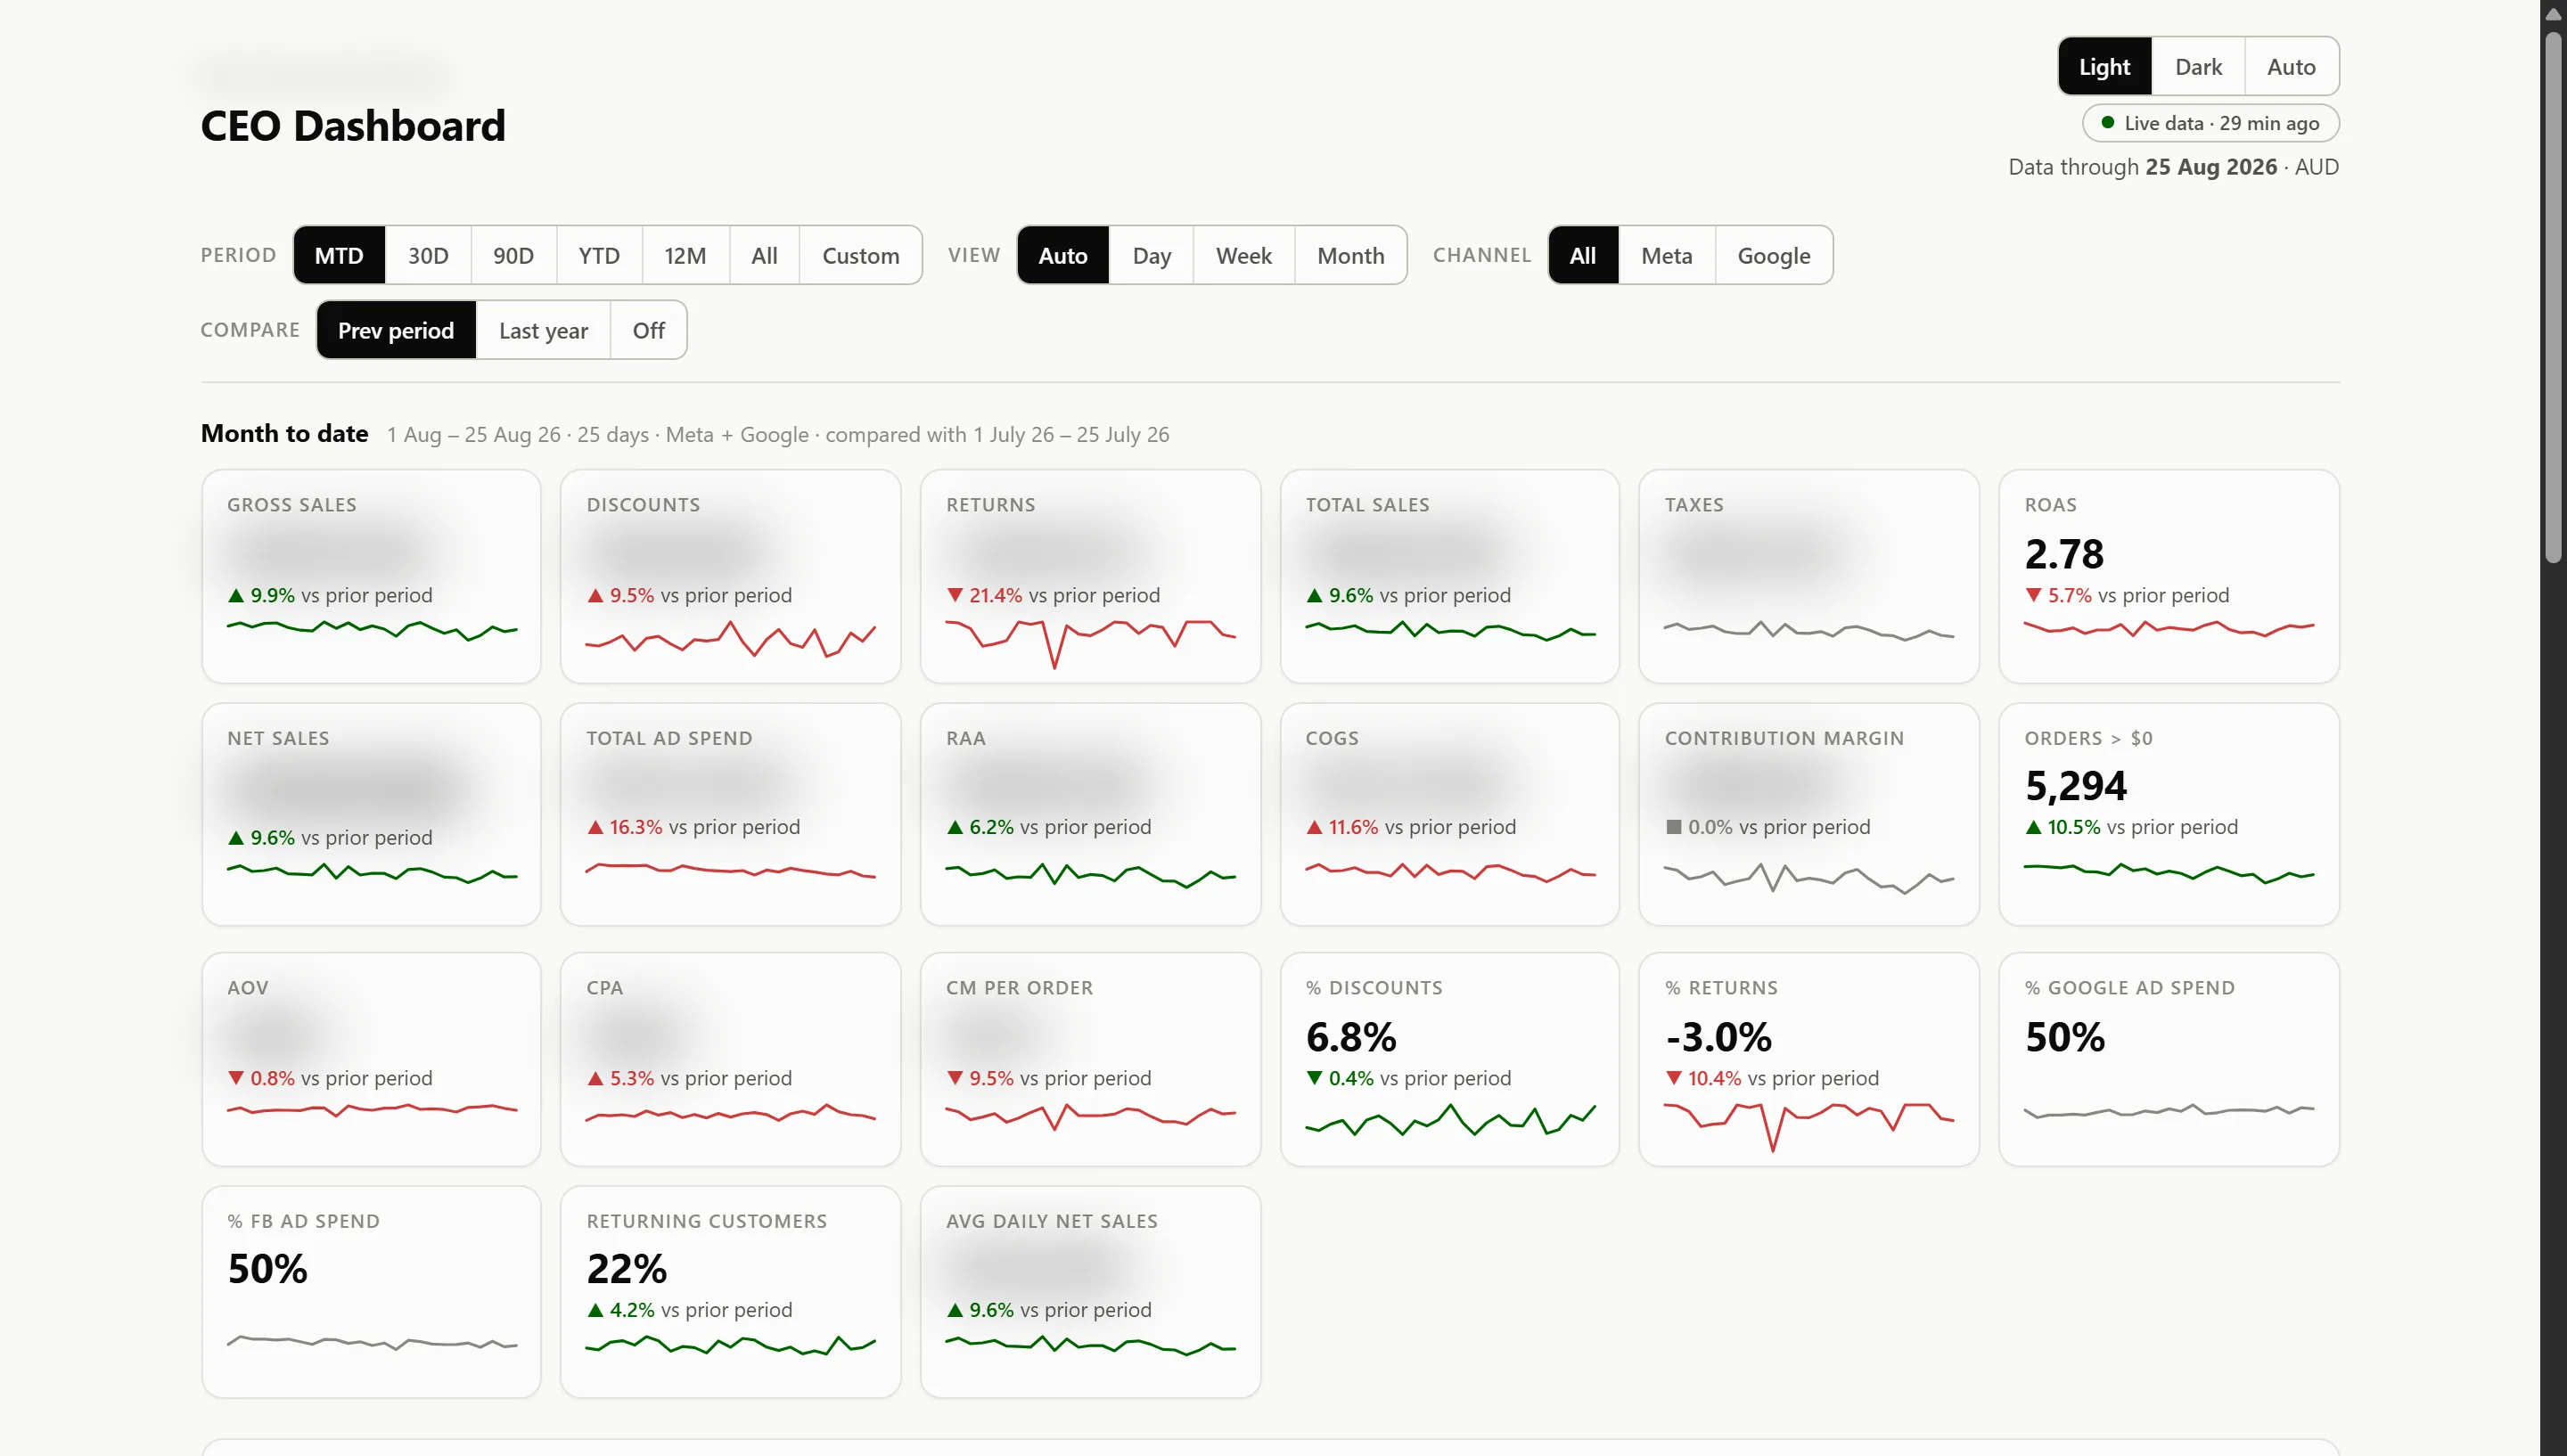
The agency runs the whole portfolio from one place instead of one client at a time. Pick a dashboard to see it full size.
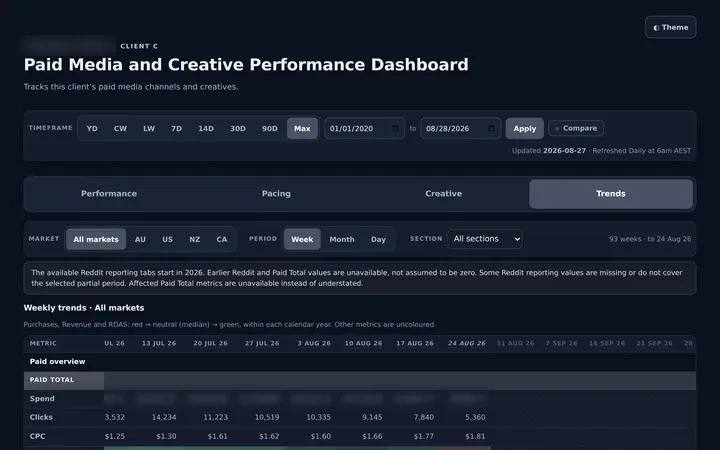
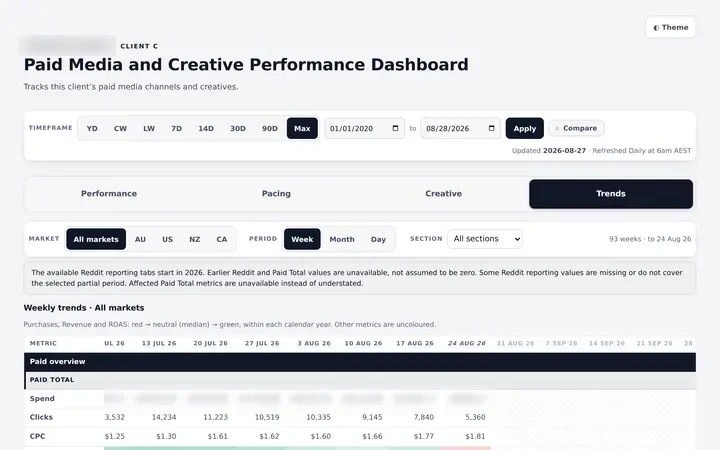
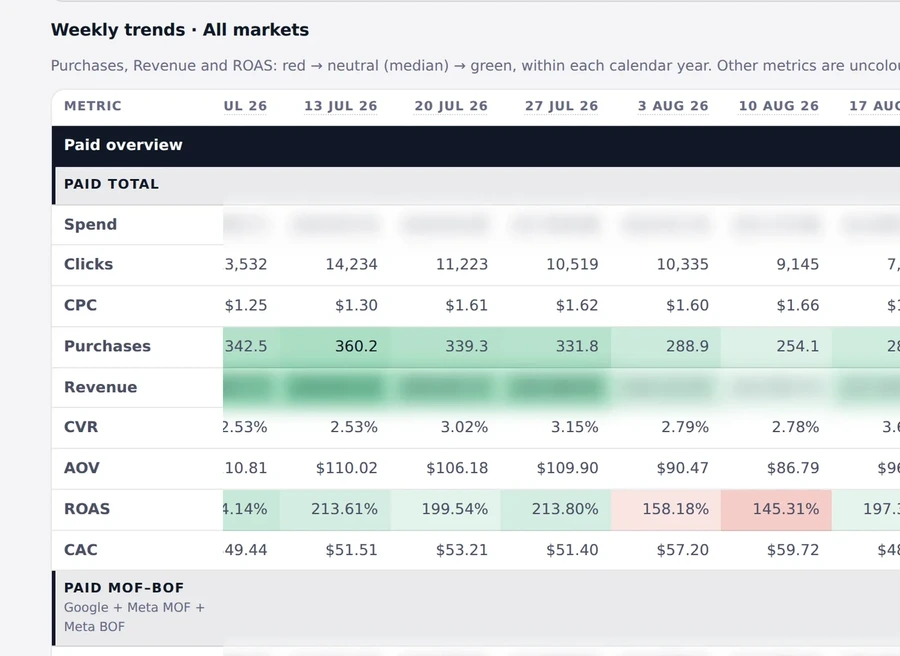
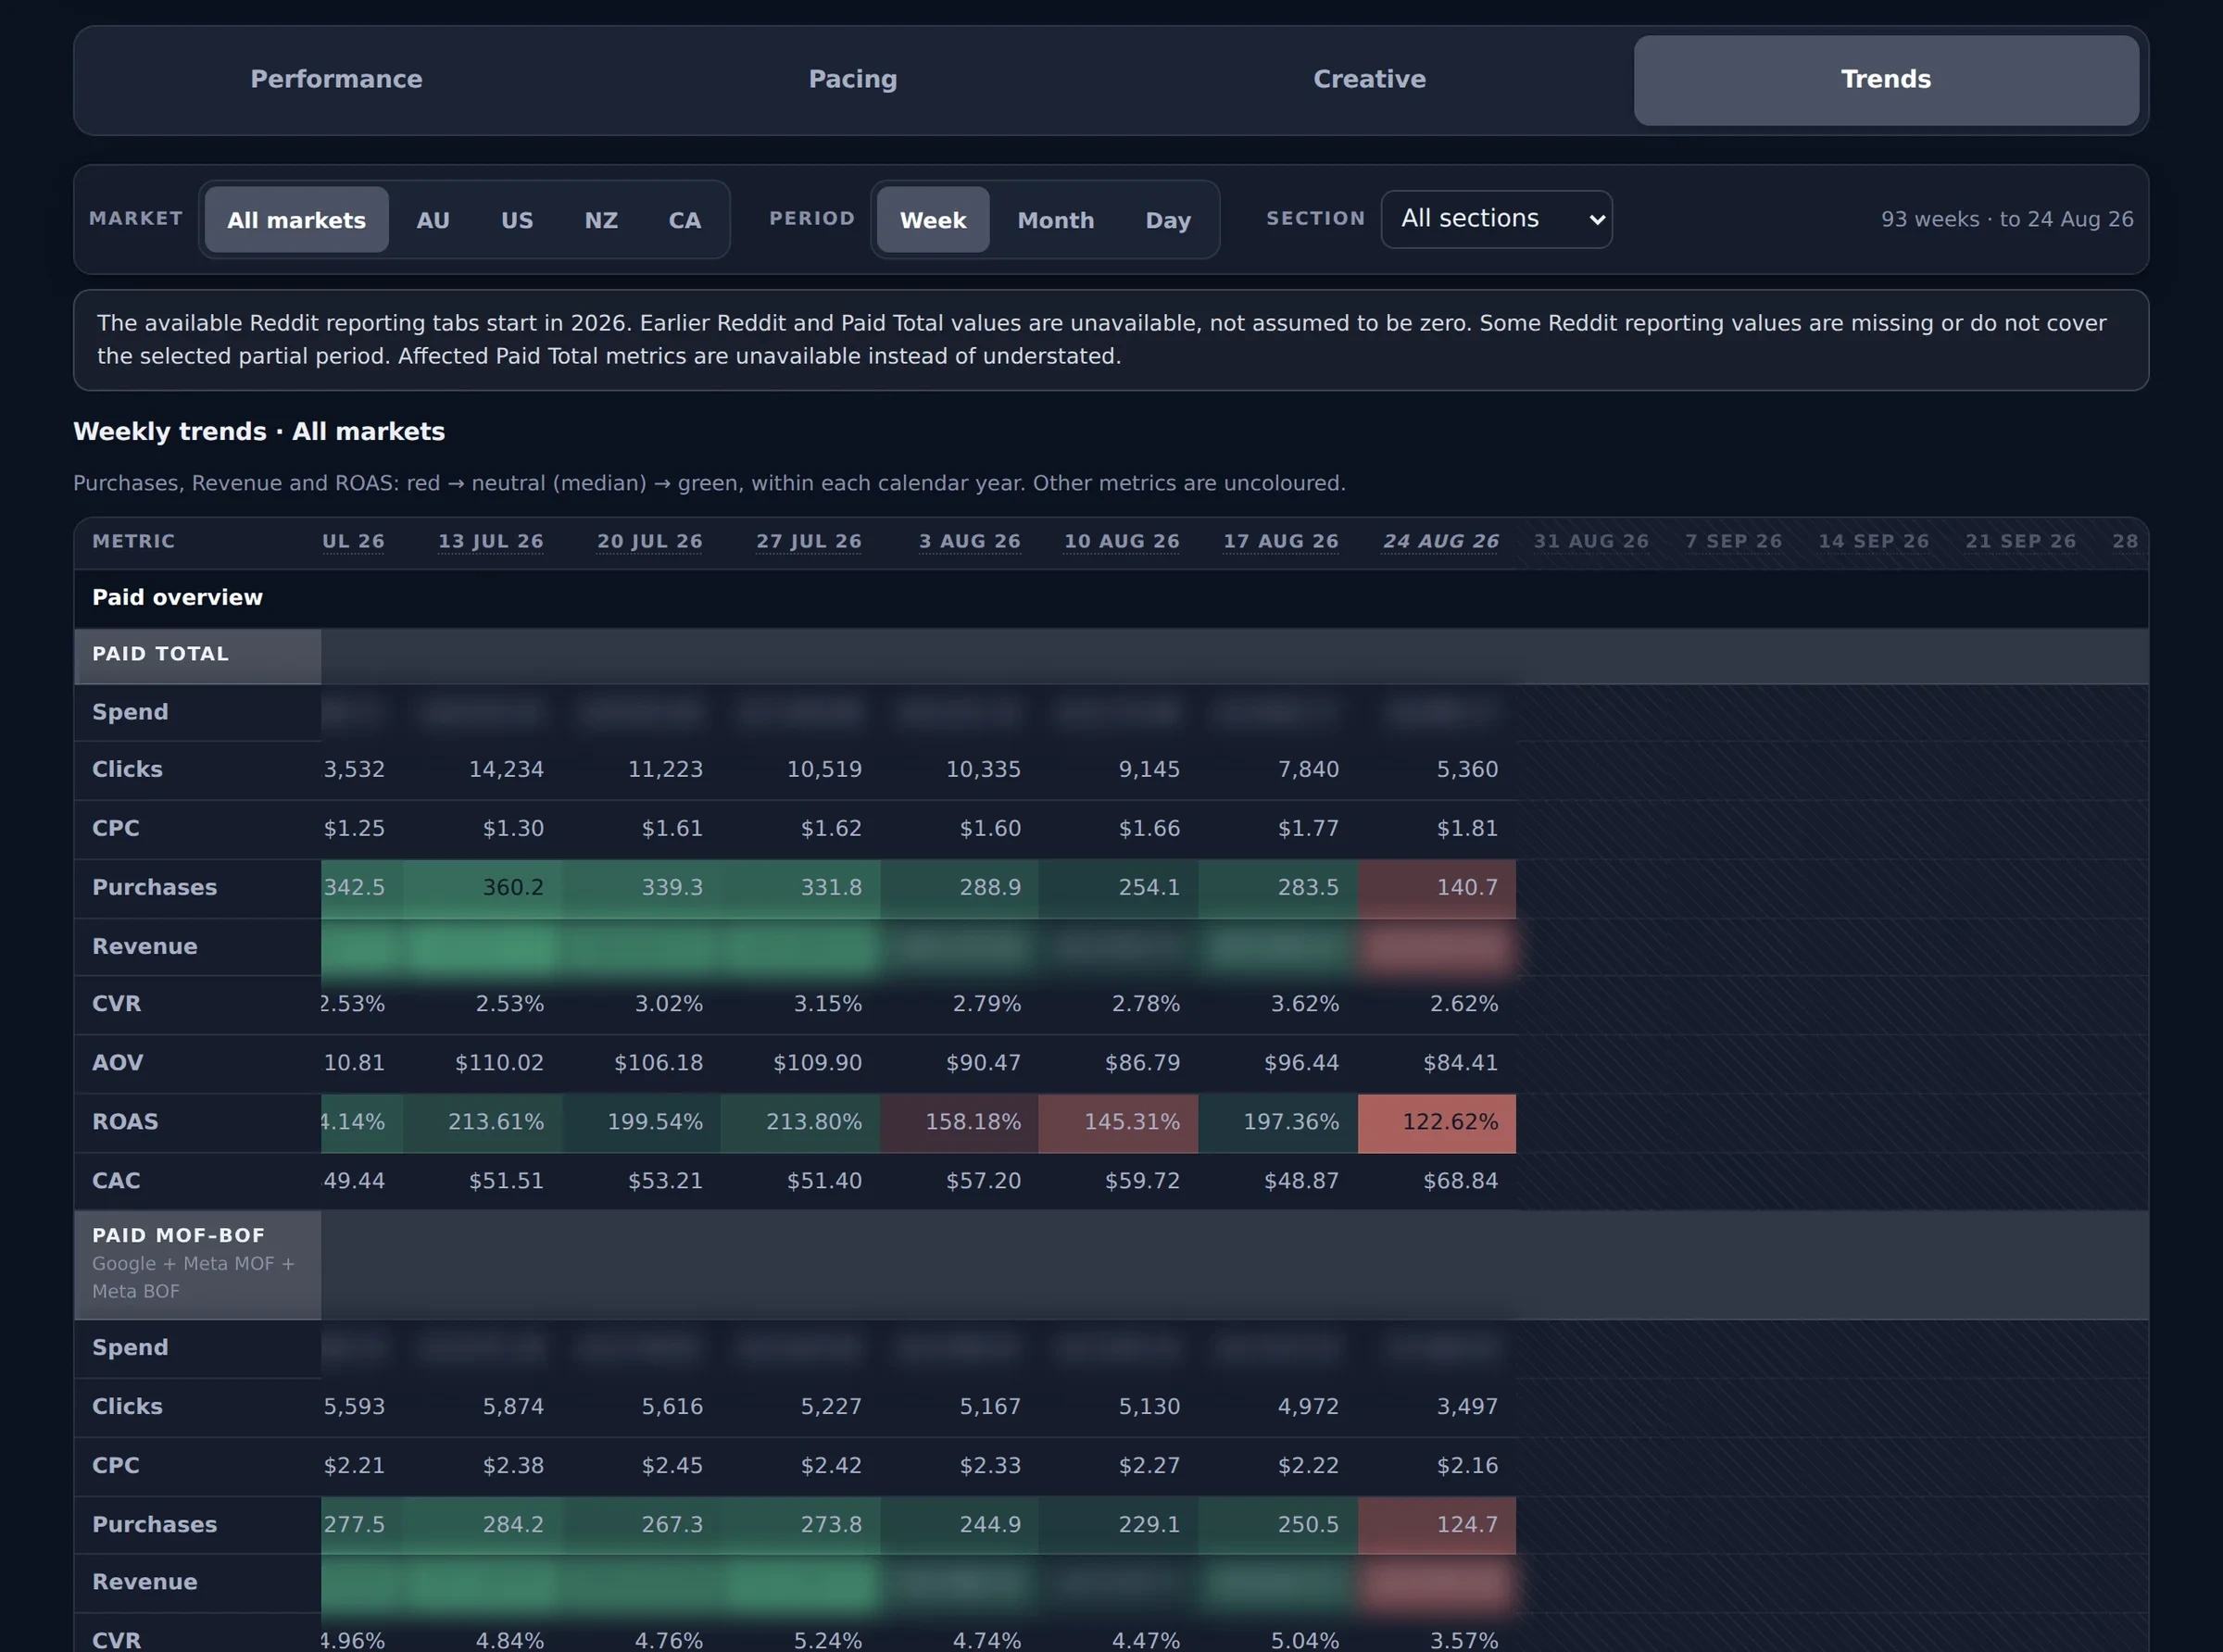
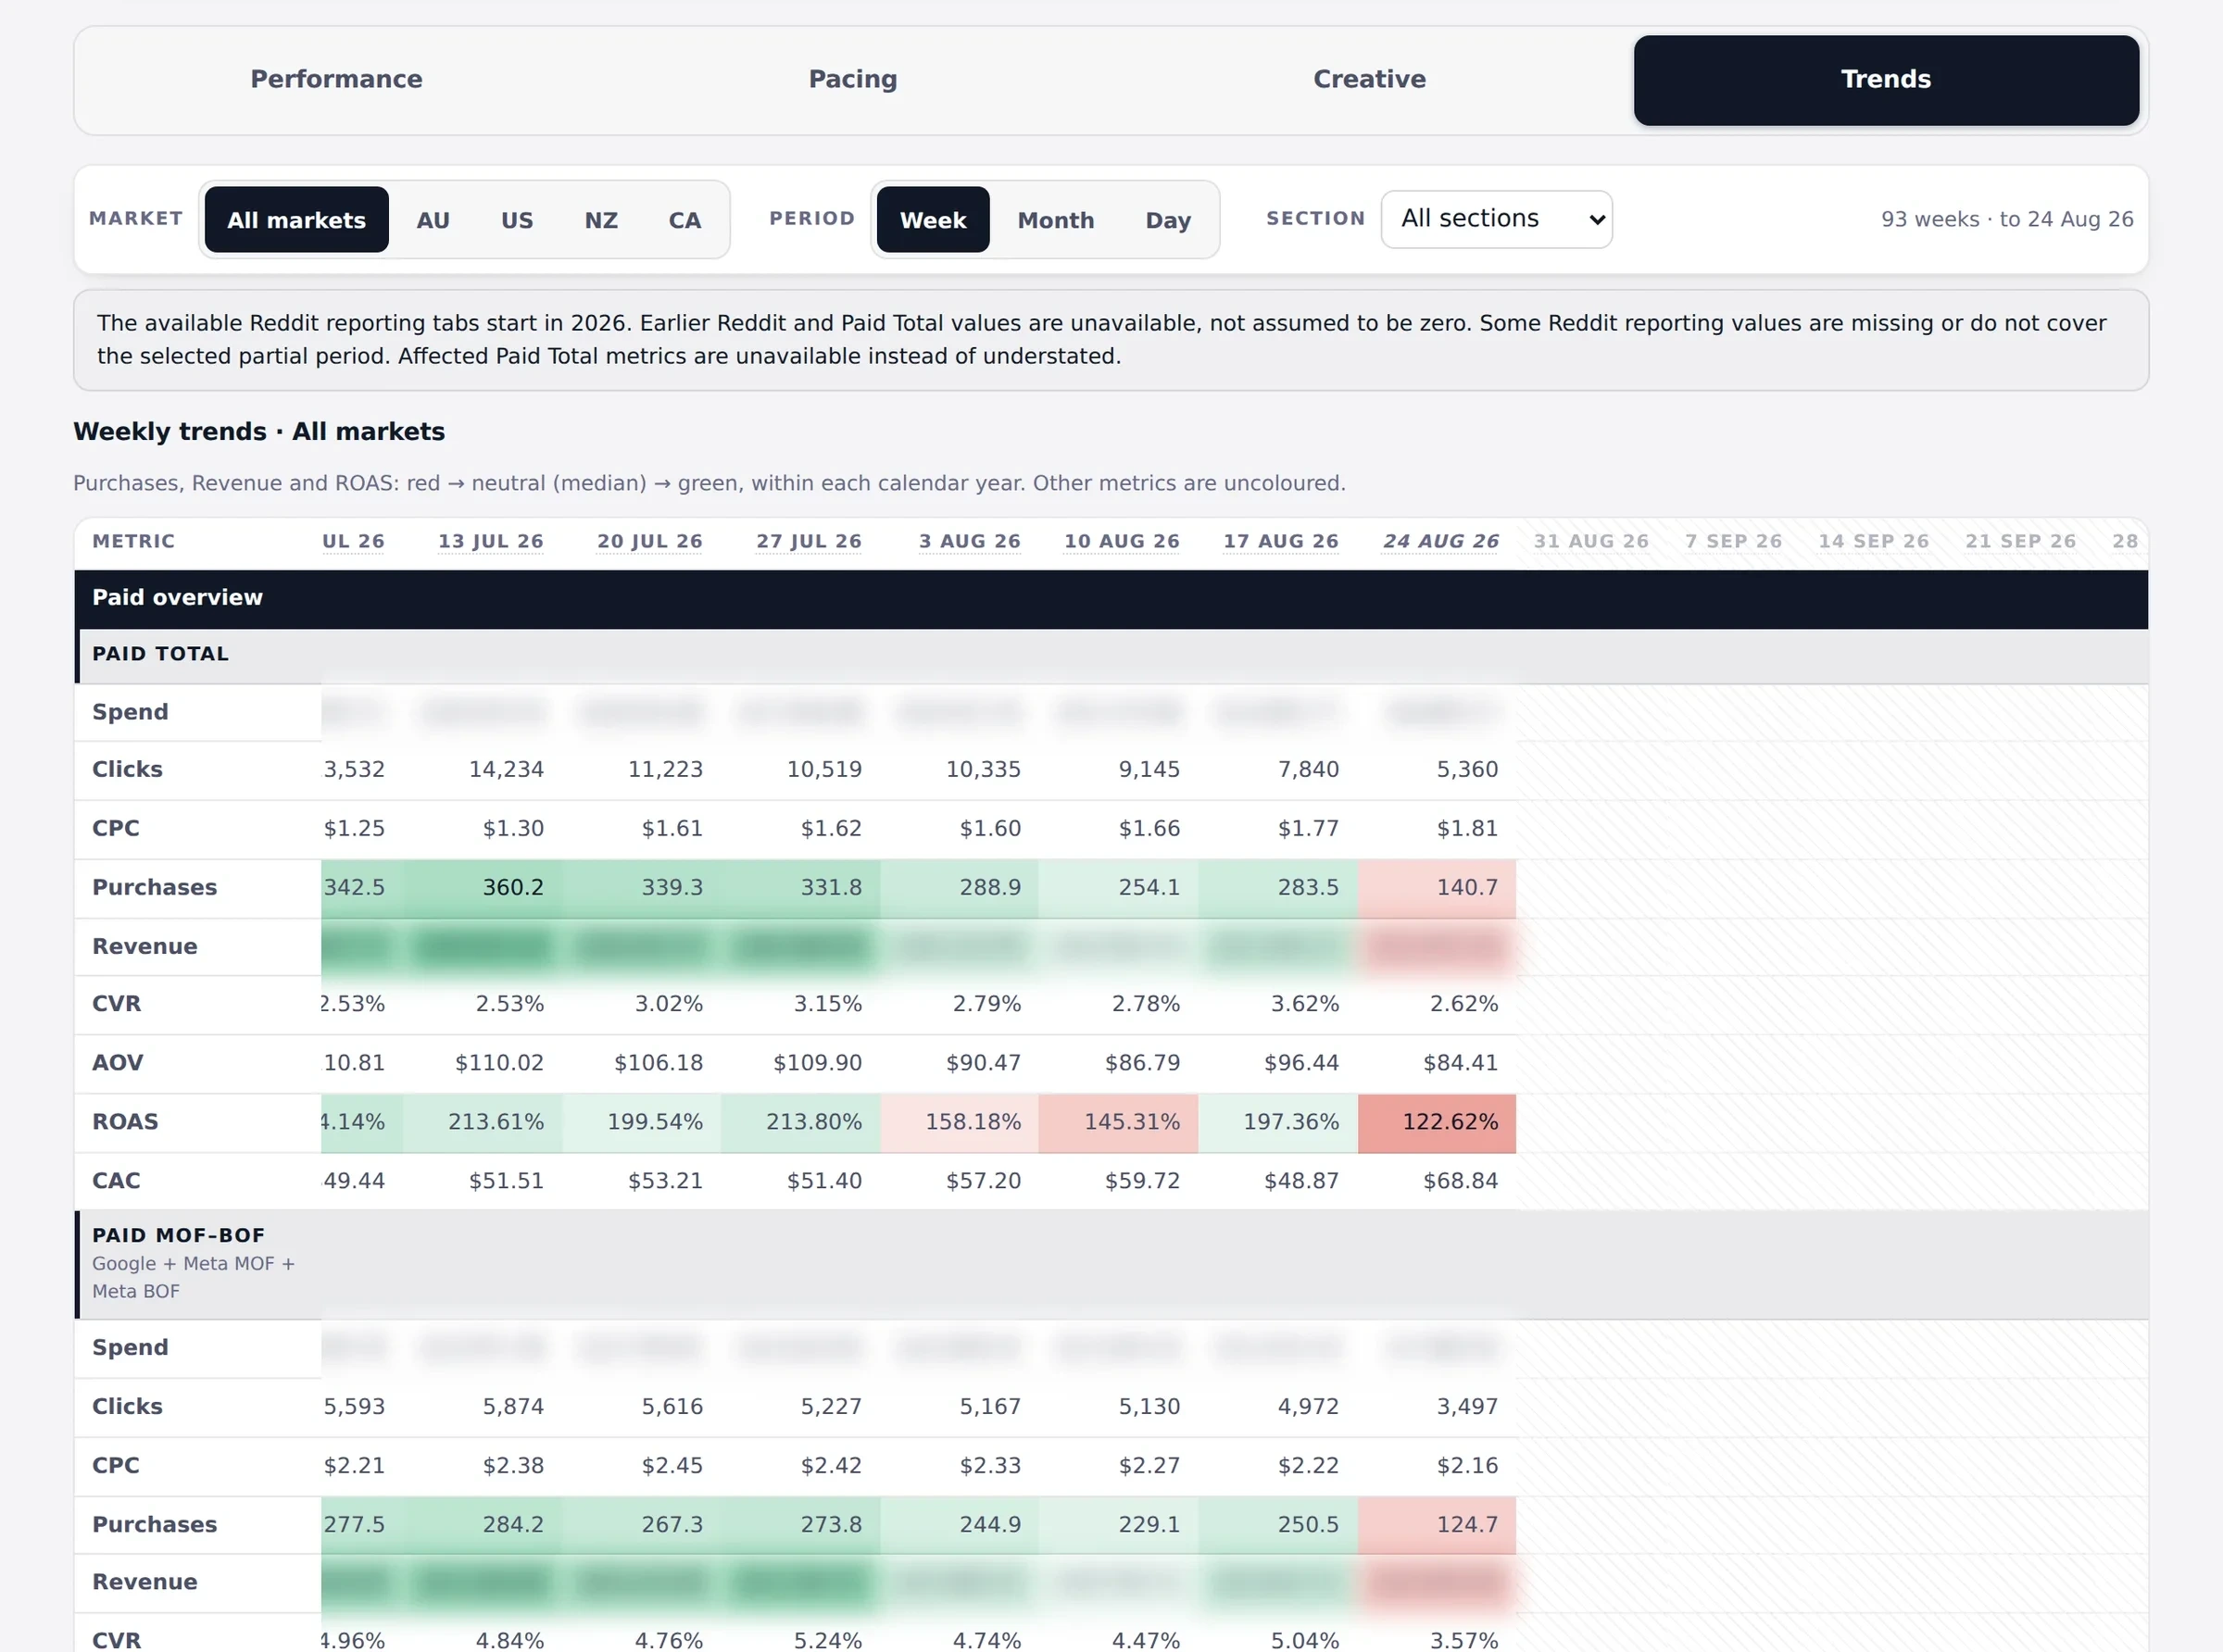
Trends: what is getting stronger, and what is slipping
This is the tab people open first. Ninety three weeks sit side by side, so a change shows up as a shape instead of a number someone has to remember. Green means it is getting stronger, red means it is getting weaker, and a client can see which way their account is heading in seconds.
The layer underneath
The dashboards are the thin part
Four ad platforms land in one warehouse on a schedule. Every dashboard, every digest and every report reads that warehouse instead of the platforms.
ReadSix client dashboardsPlus the weekly creative digests that post straight into each client's channel.
StoreOne warehouse, refreshed on a scheduleAd performance, creative metadata and thumbnails land on four and six hourly cycles. Conversion lag snapshots are captured and then revised, so a number that matures later is never read as a number that changed.BigQuery
Adding a channel is a pipeline, not a rebuild
Total first, then per channel and per market, so where the money went and what it brought back is one screen rather than four tabs. And when this client added TikTok, nothing had to be redesigned — a pipeline was pointed at the warehouse and the channel appeared in the controls that were already there.
Live client dashboard, channel and market controls.
Credentials live in one place
The ingestion flows read platform credentials from a single client record instead of carrying their own. Onboarding a new ad account is configuration, not a new workflow.
The bridge
The same data, asked in a sentence
The warehouse is not the only way in. A read only bridge exposes the agency's Meta estate to an AI client, so a question can be asked directly instead of routed through a dashboard.
Asked
Which campaigns moved most against the previous period, across every account we run?
BridgeA read only Meta bridgeIt discovers every business portfolio and ad account the agency's token can reach, 14 portfolios and 22 ad accounts at the last count, and exposes them behind per client bearer tokens. The underlying platform credential is never handed out.
What this replaces
Retiring a tool is something you earn, not something you announce
Some of the old stack is gone. Some of it is still holding weight. Here is which is which.
Scale
Same shell. A different question every time.
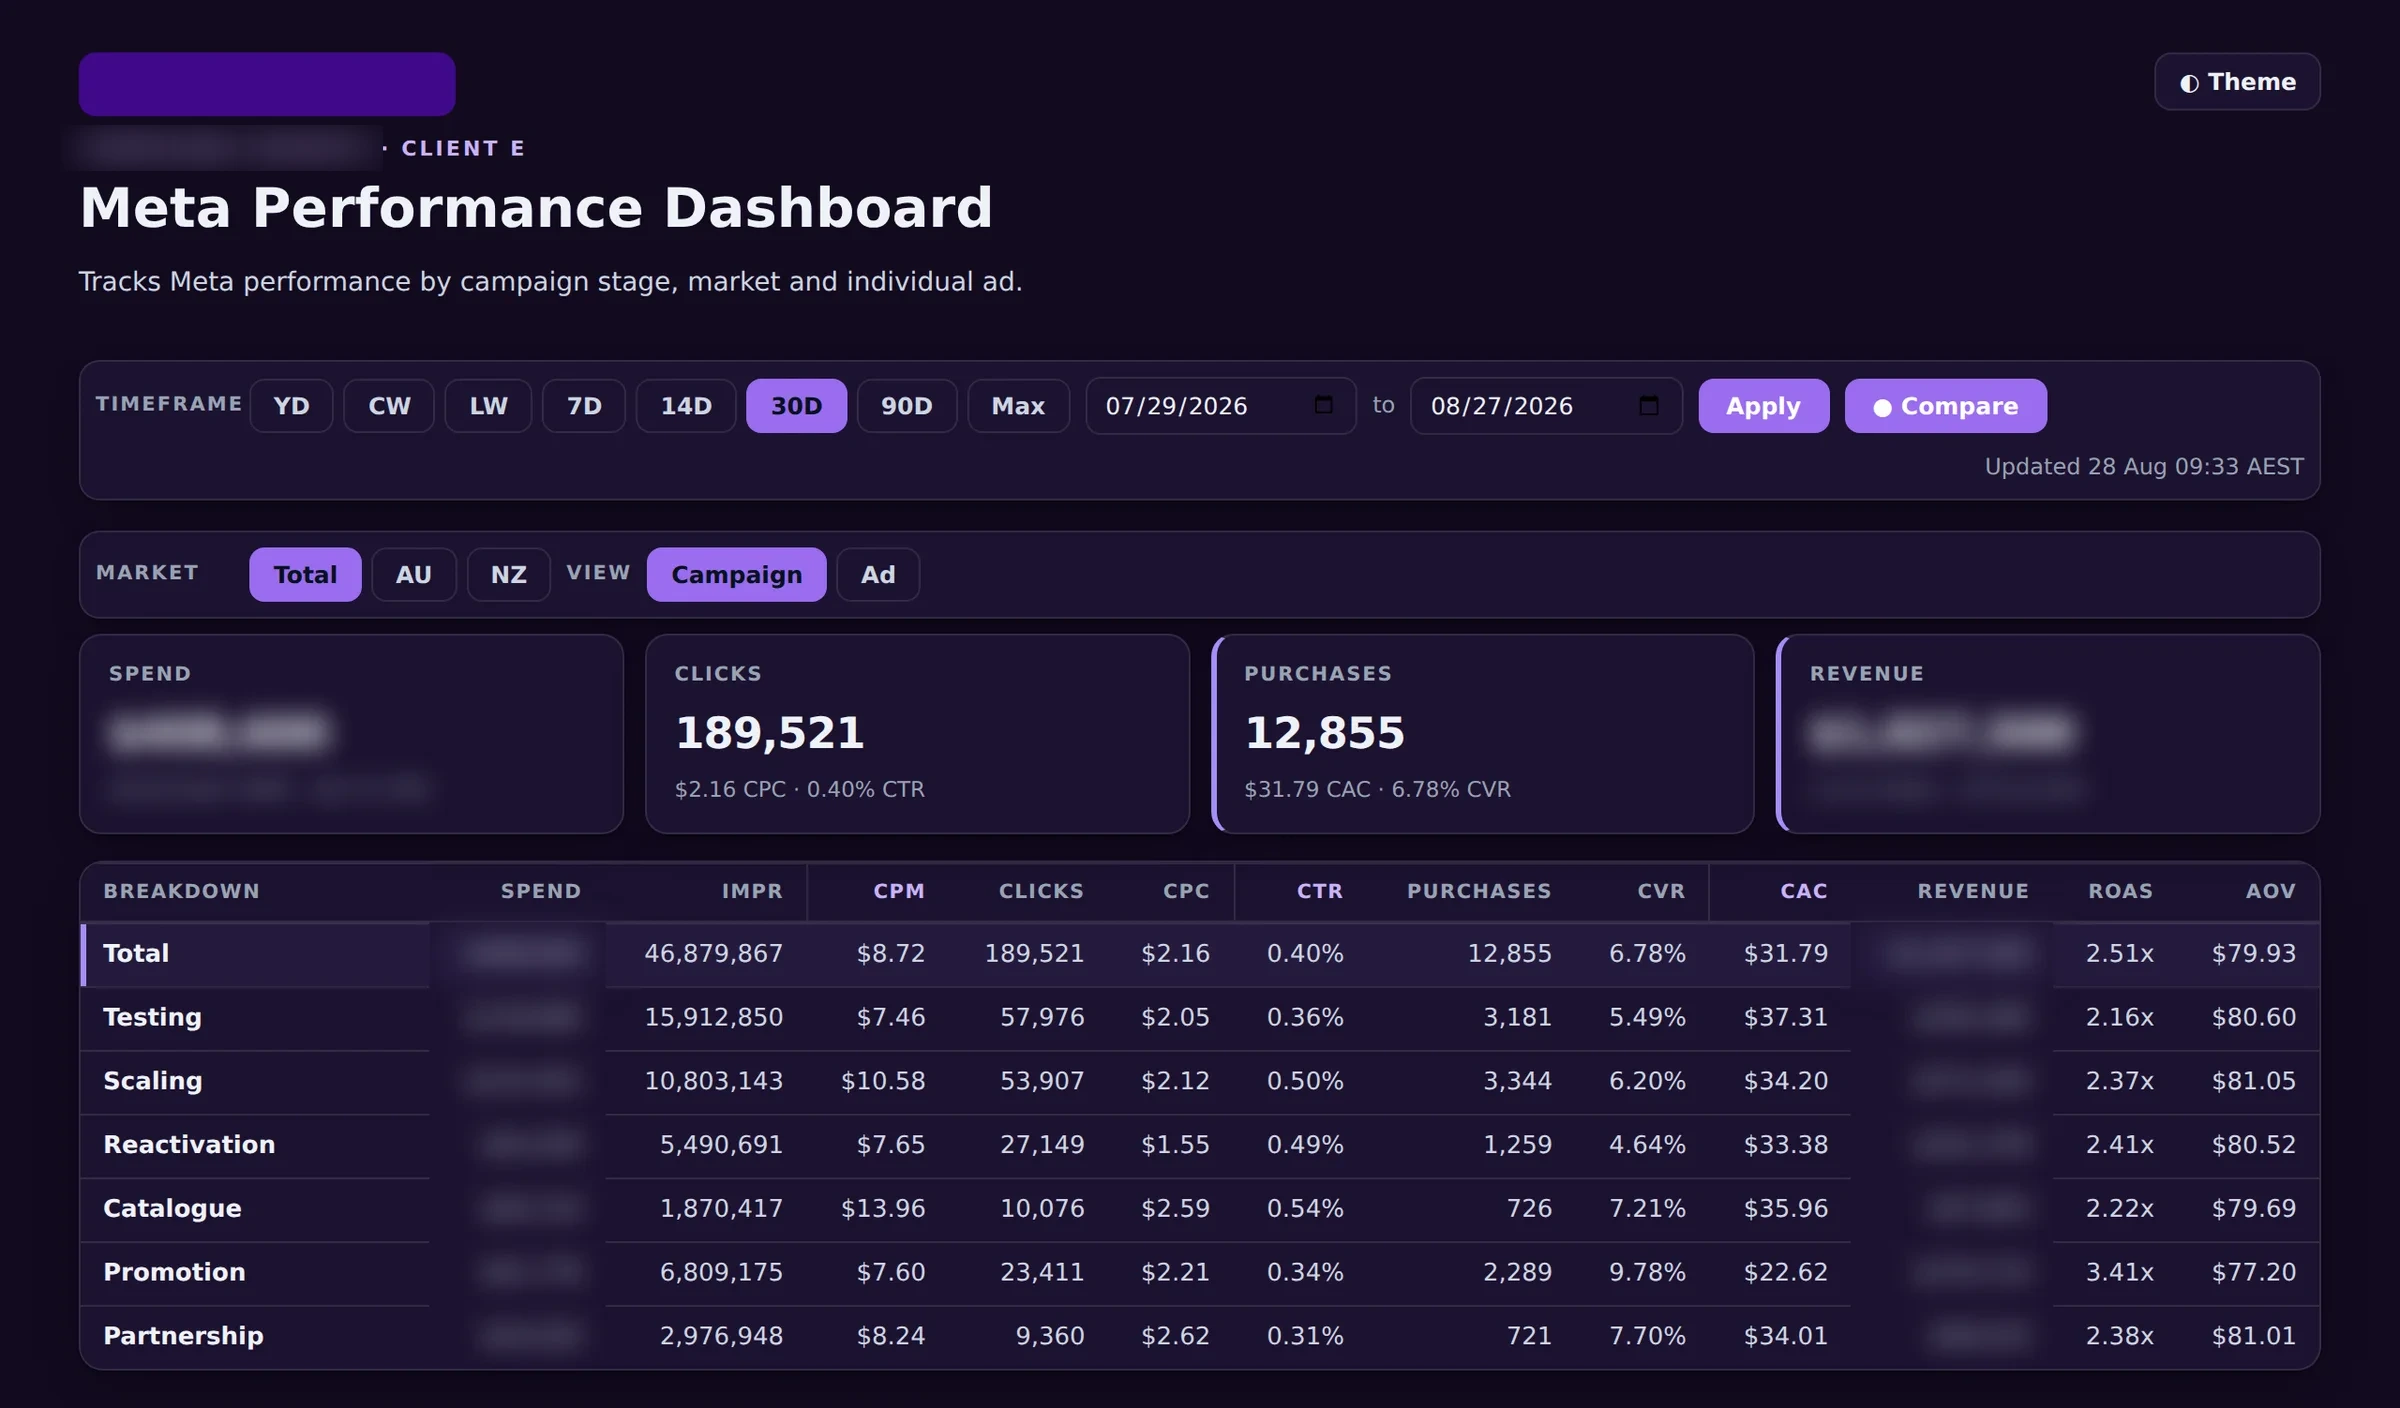
One client sells physical product in two markets and needed to read Meta down to the individual ad. There are 468 of them, and they sum exactly to the campaign totals.
So their dashboard gets a view selector and filters the others do not have. The controls stay the same. Only the question changes.
Ad level totals were reconciled against the platform before the view was released.
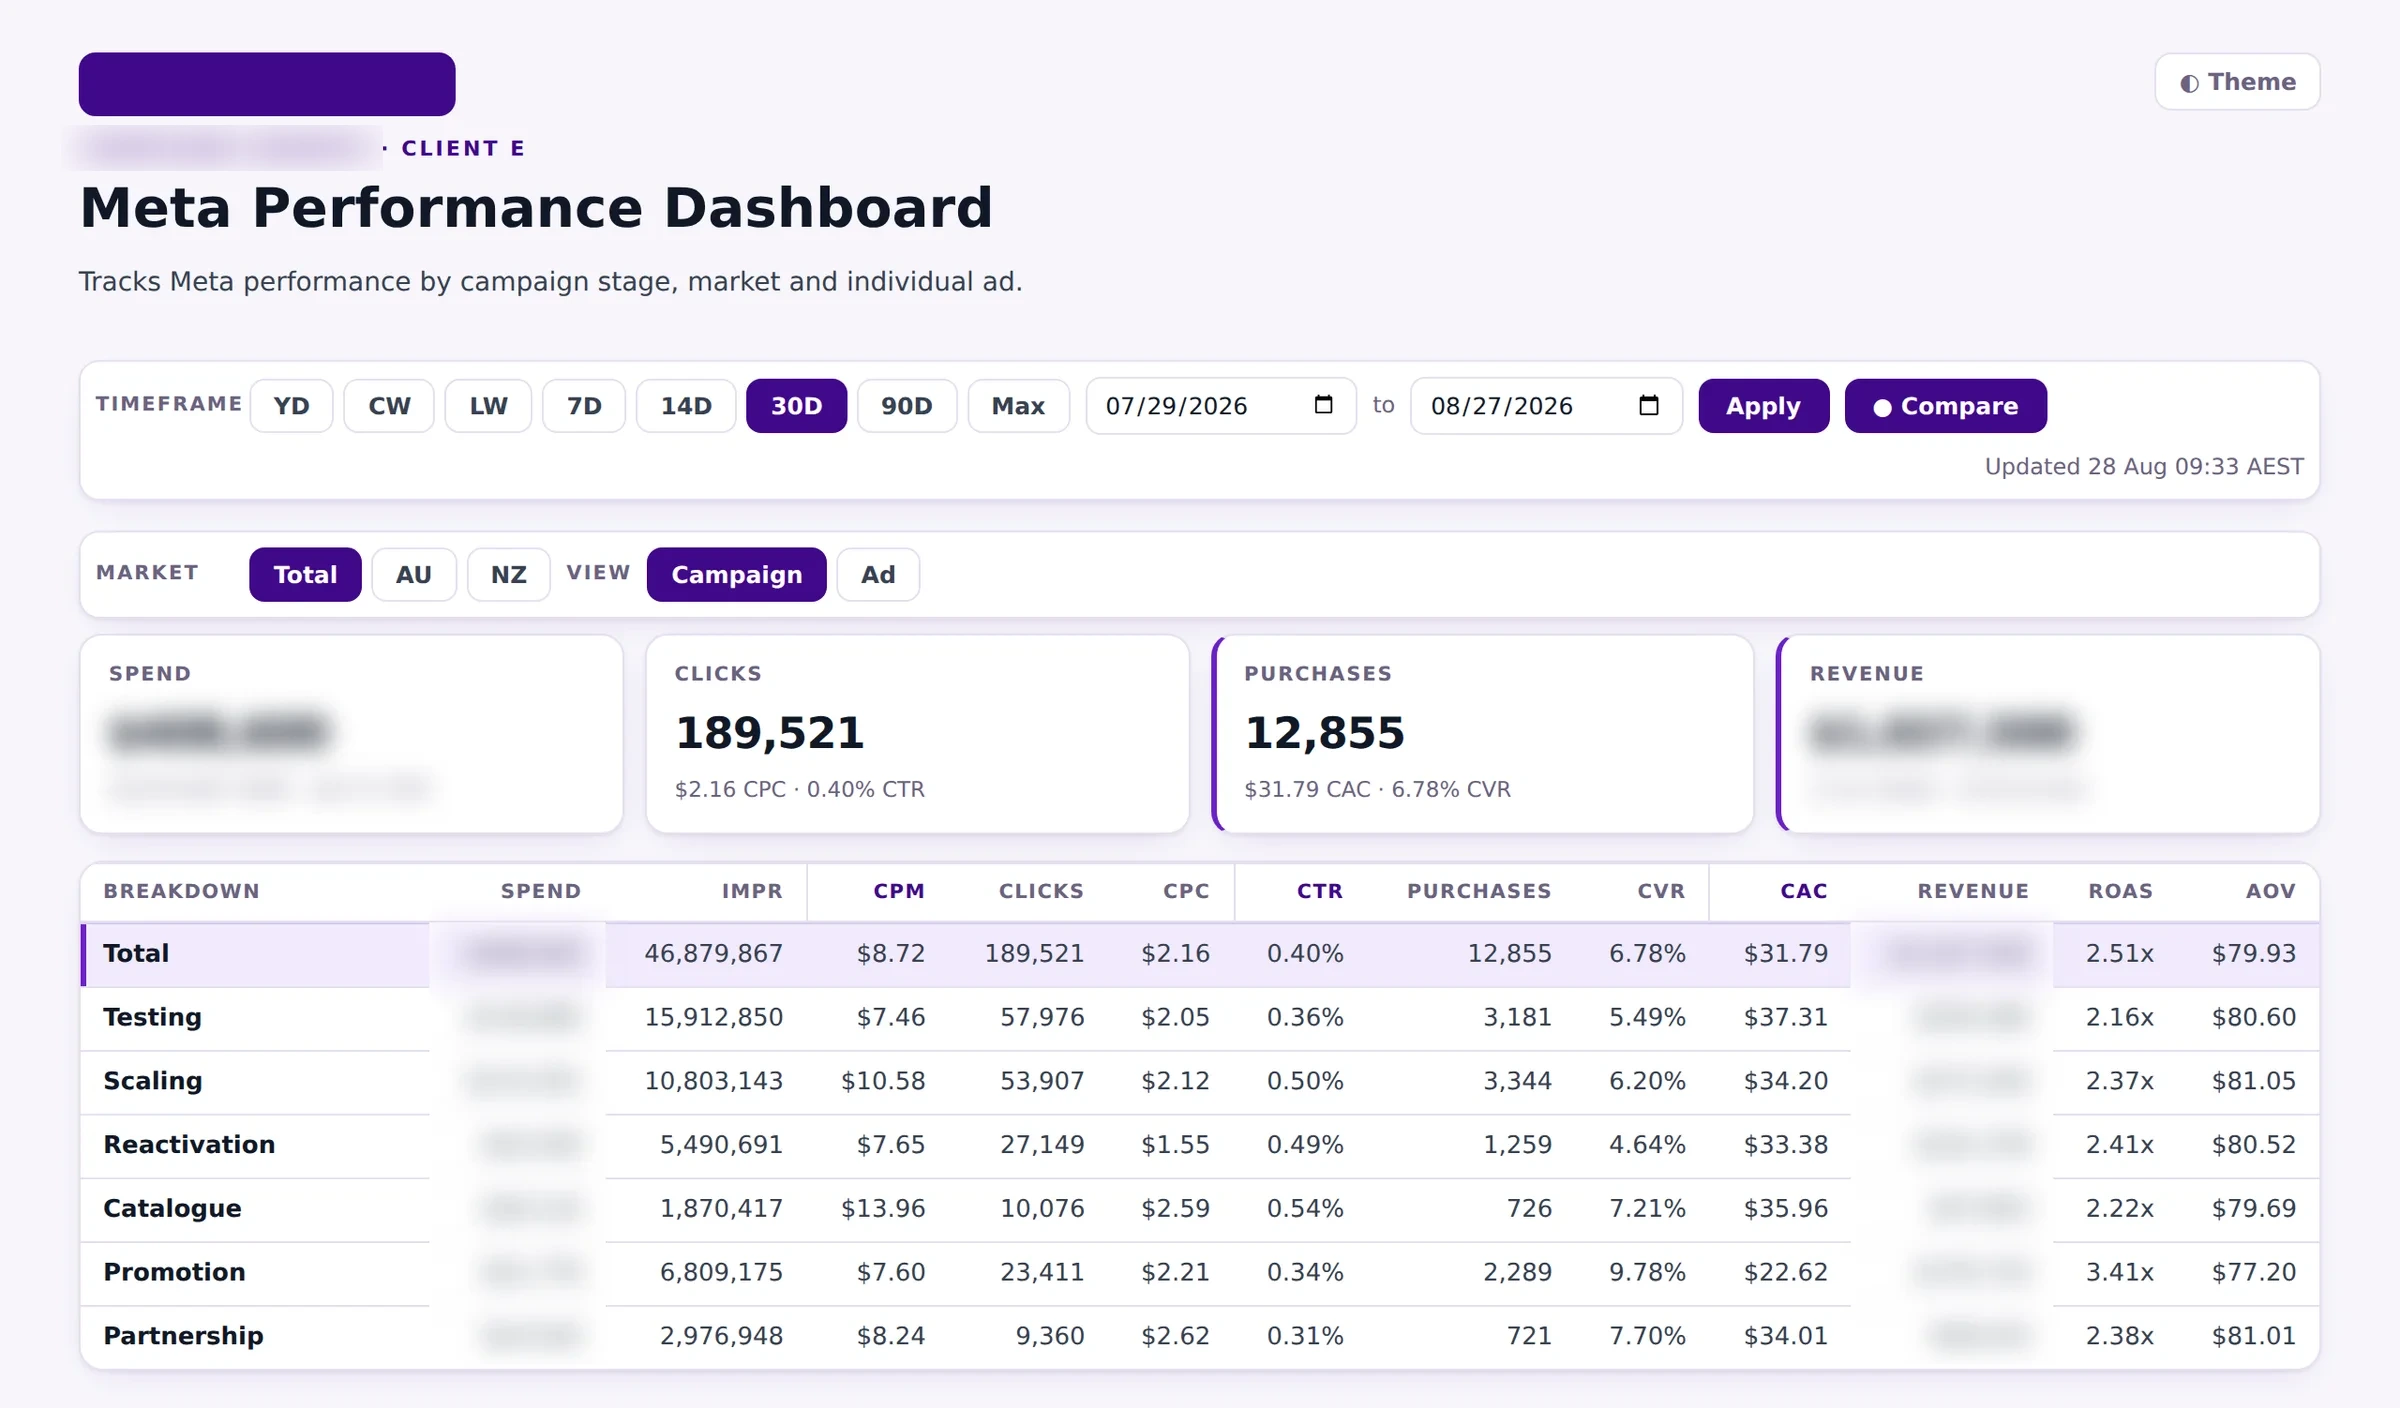
Live client dashboard, campaign breakdown.
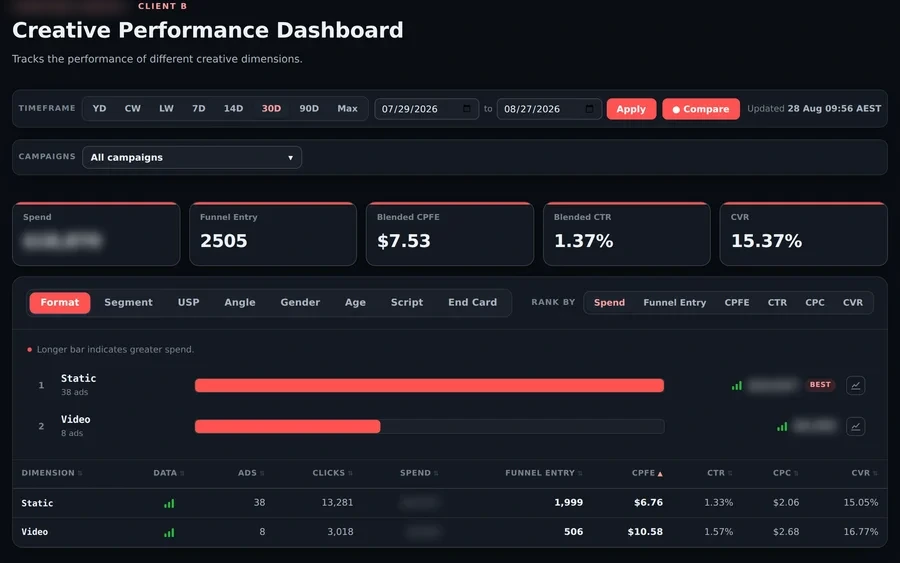
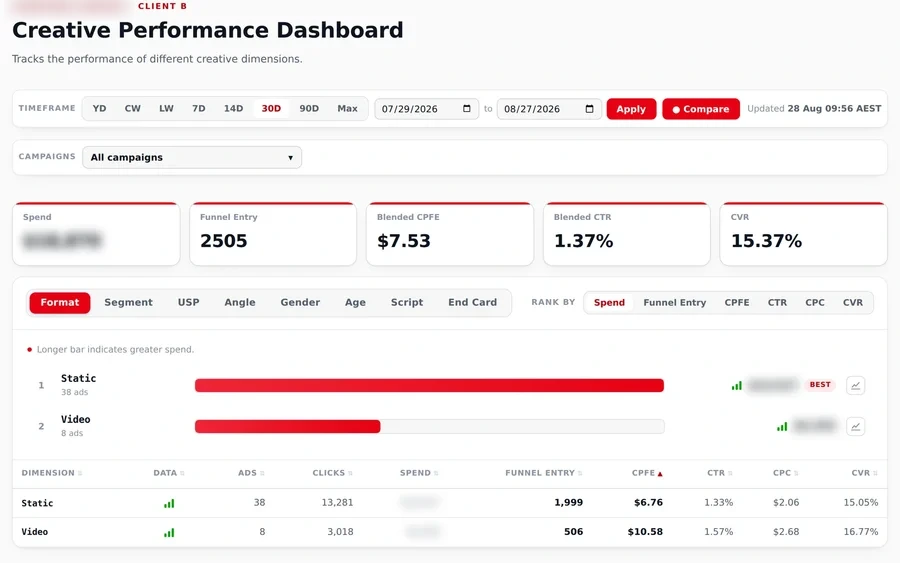
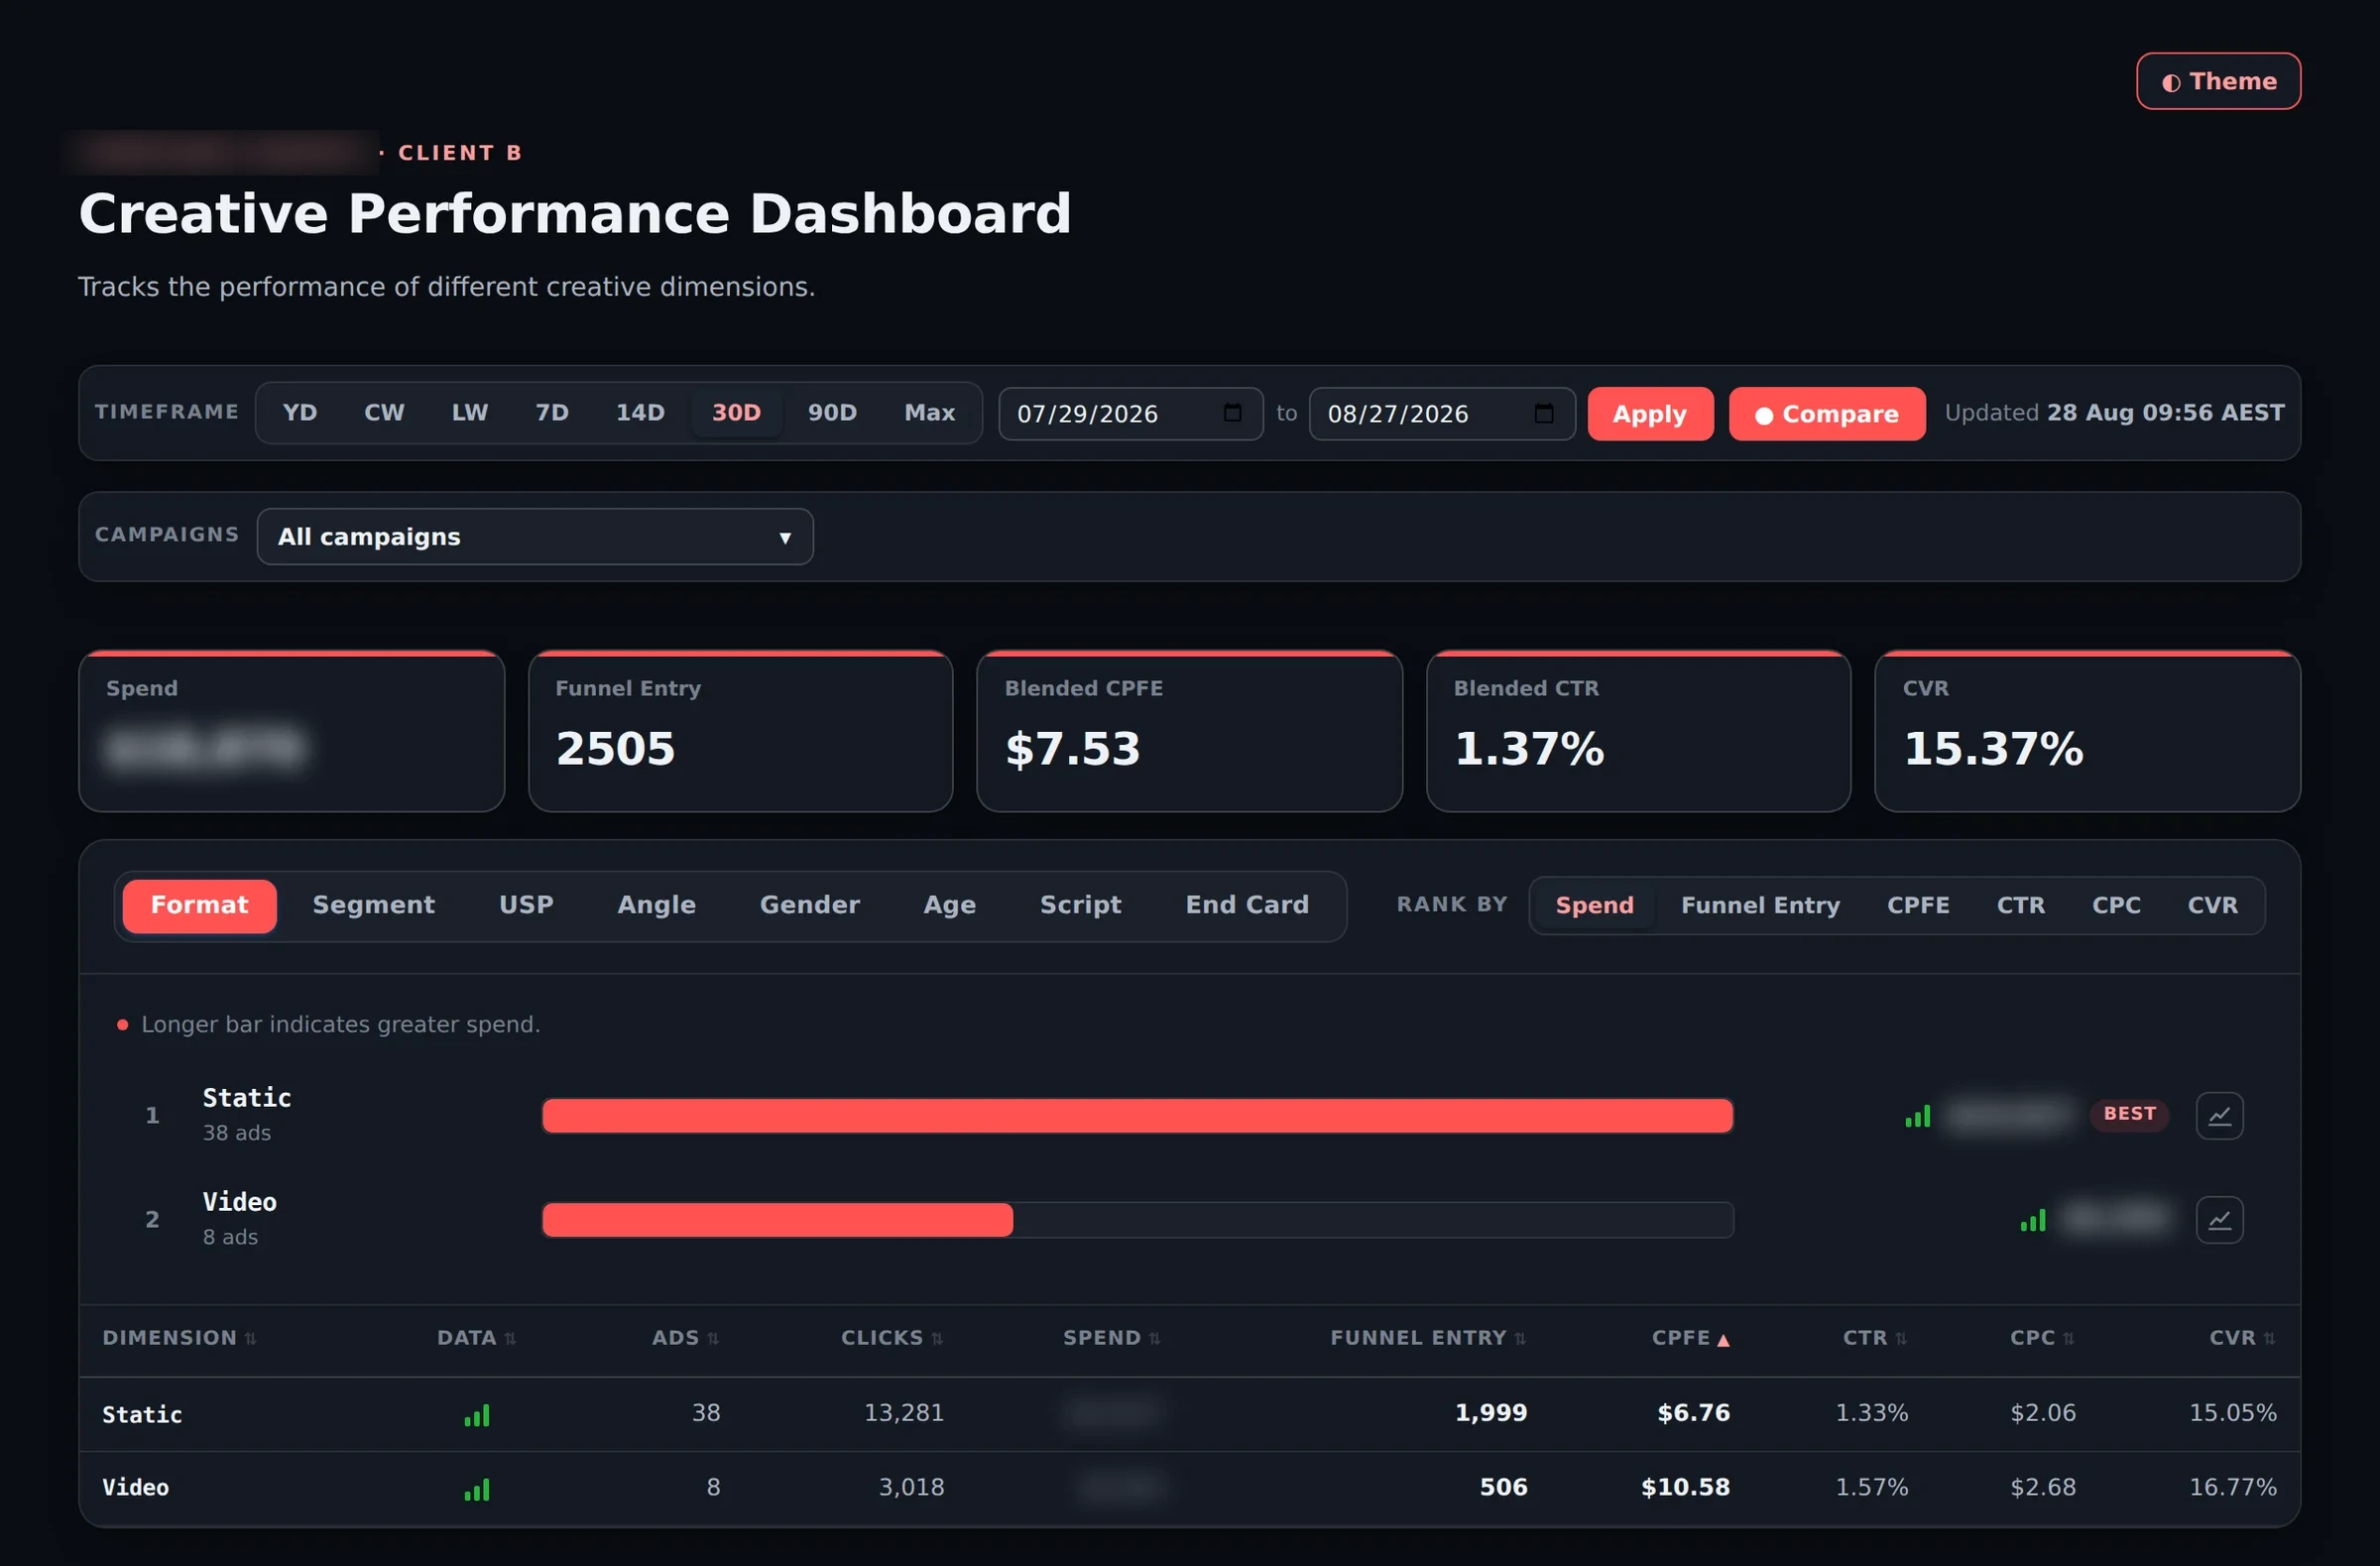
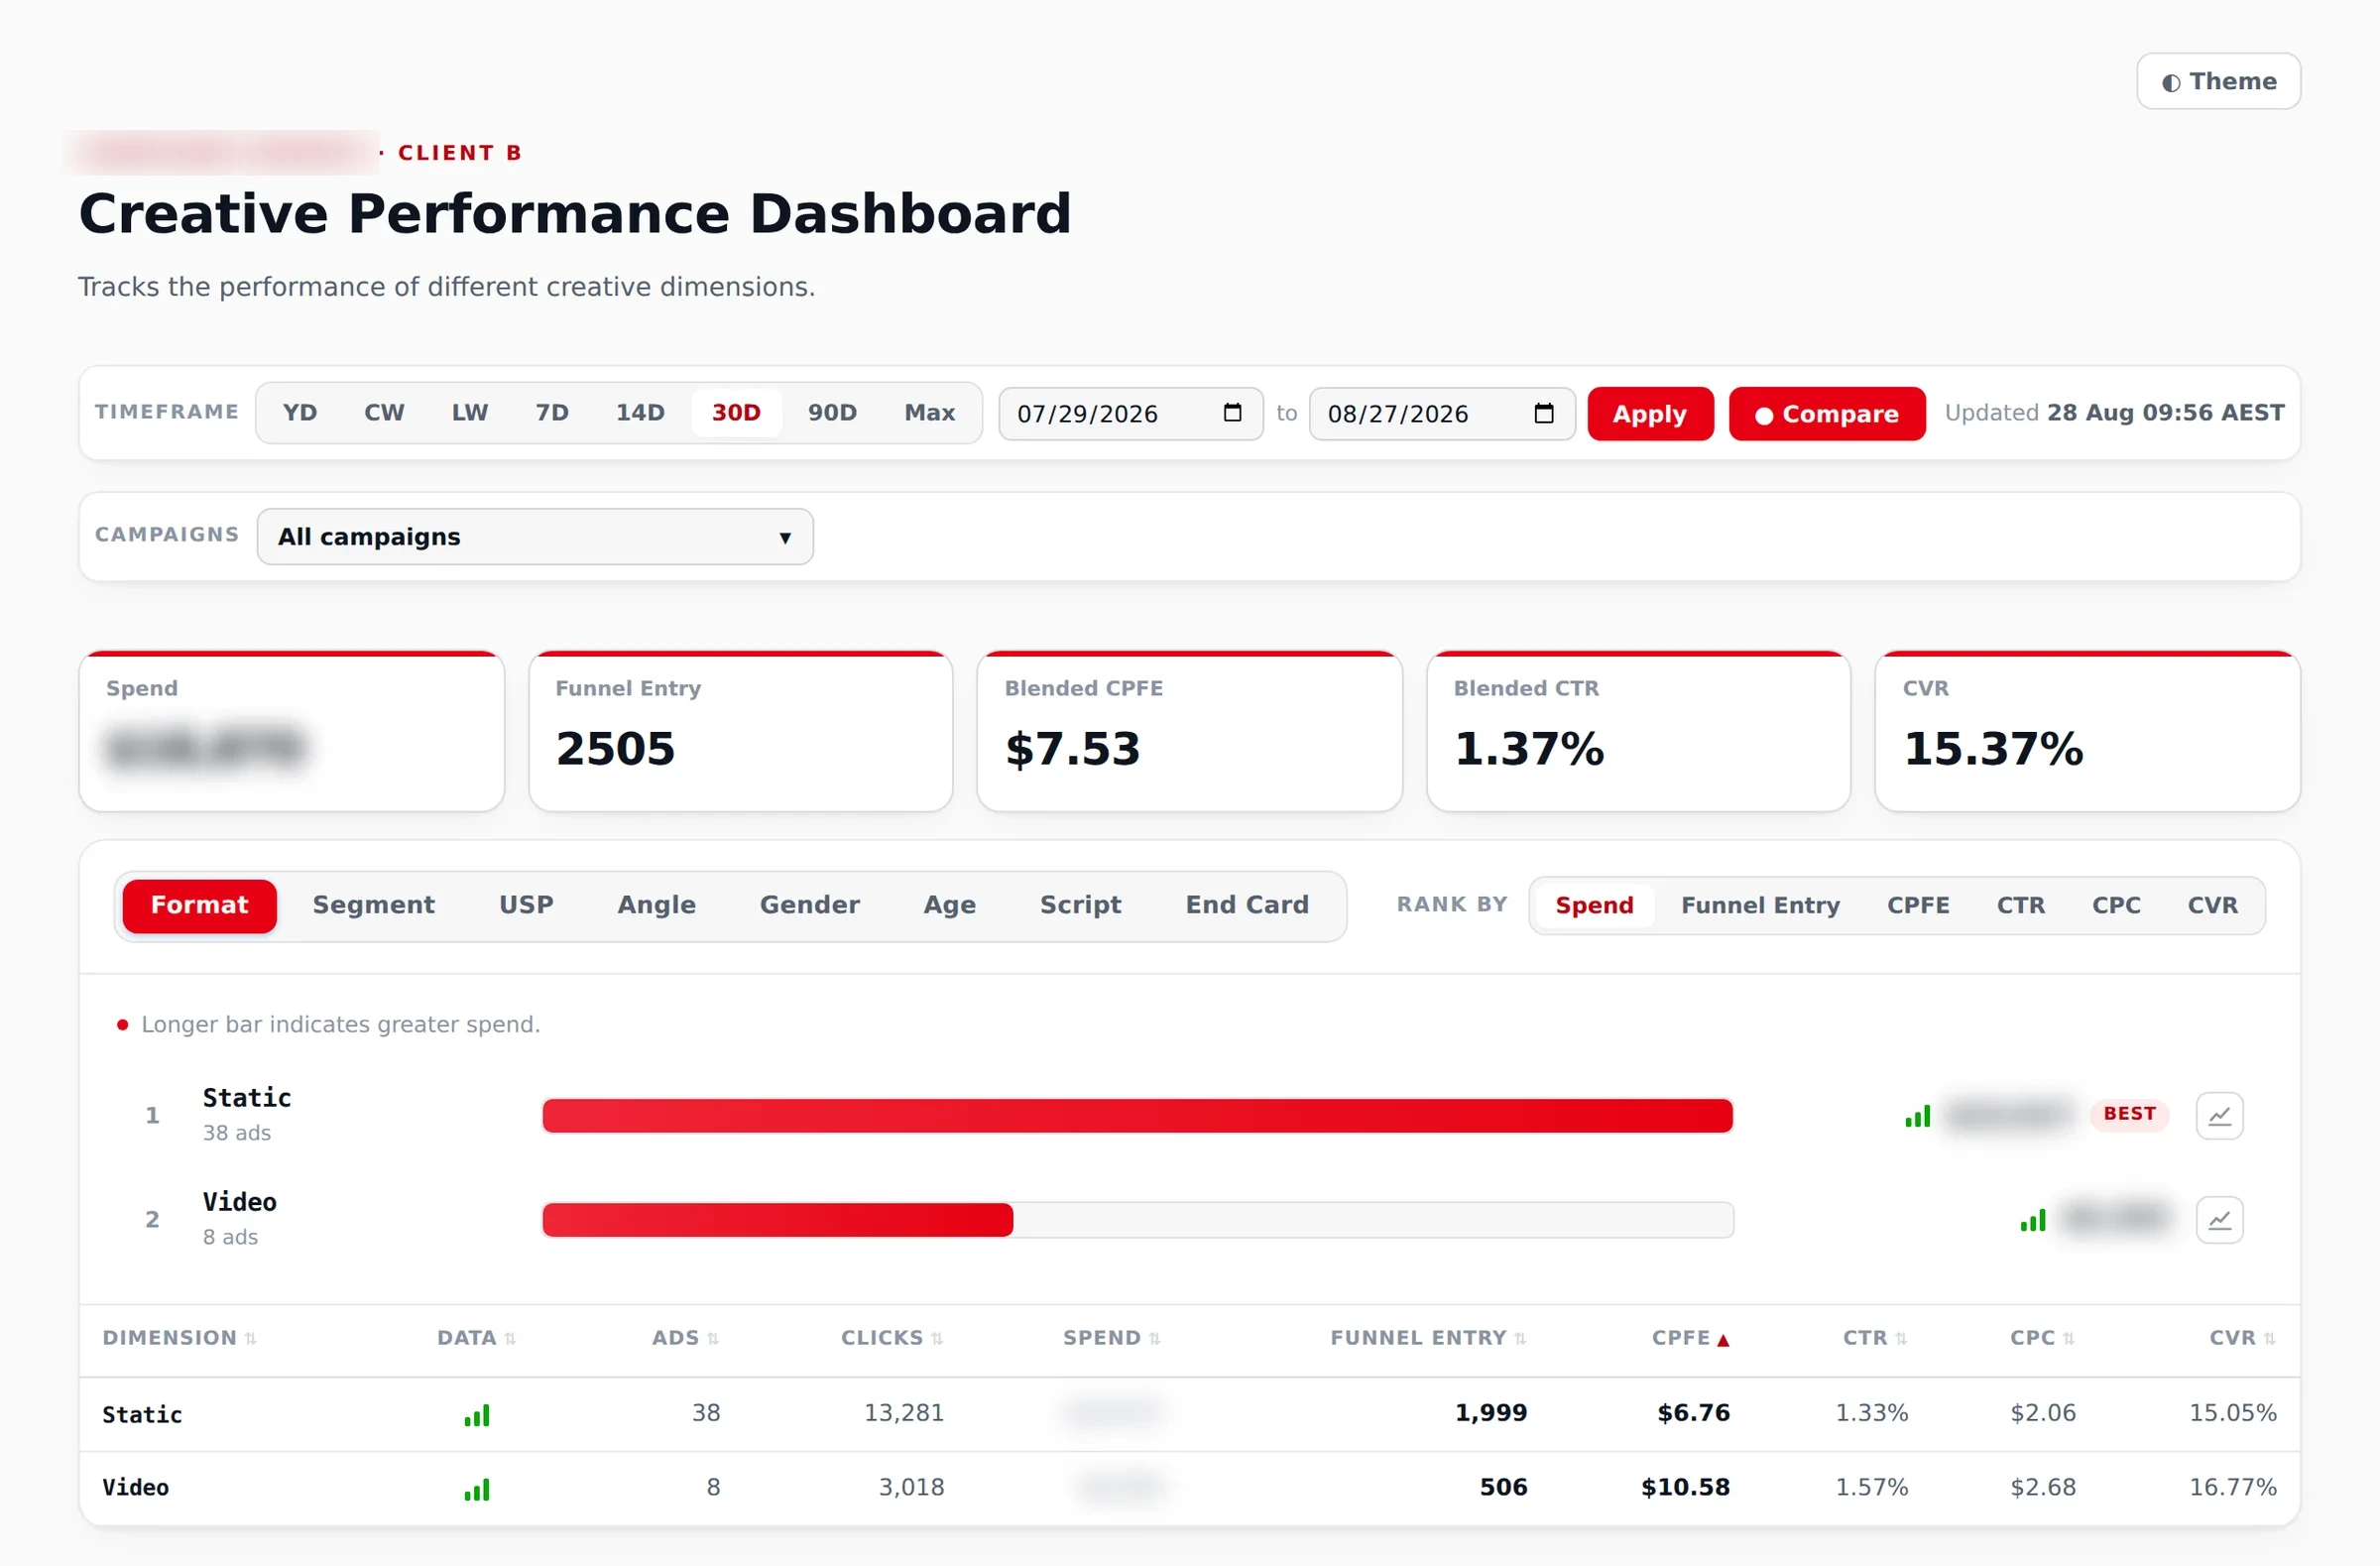
Creative
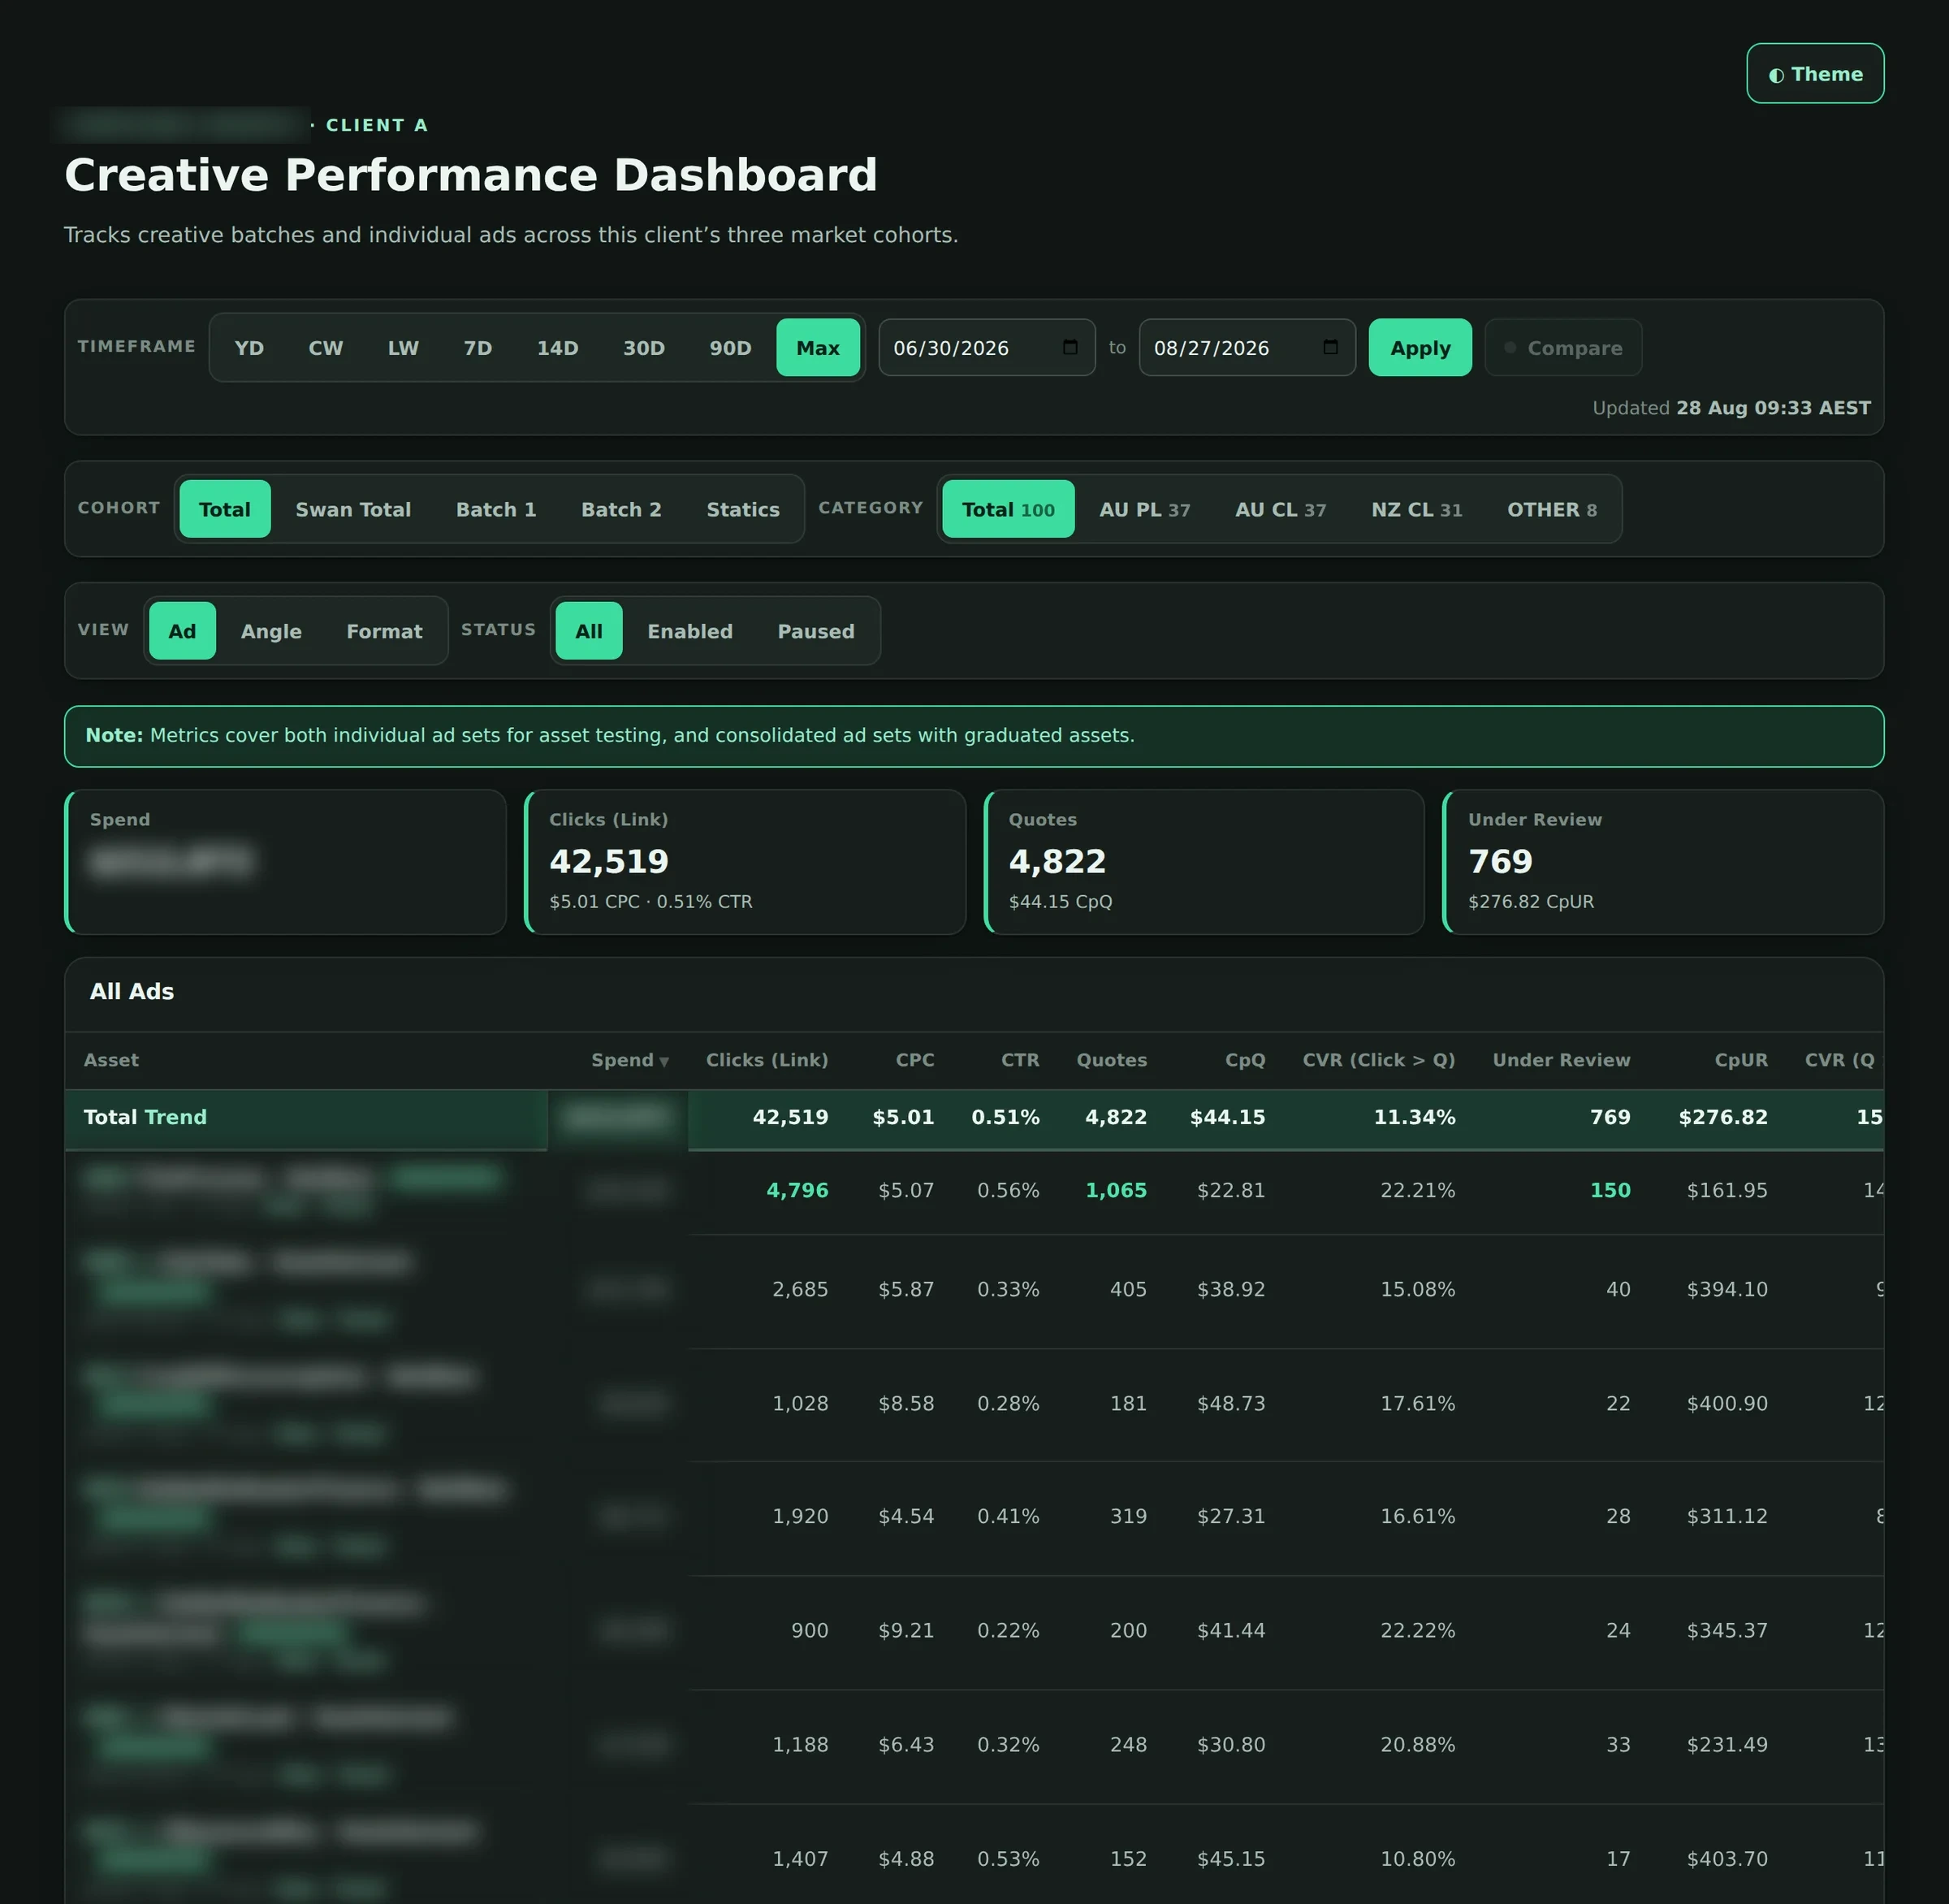
Which ads are earning their spend
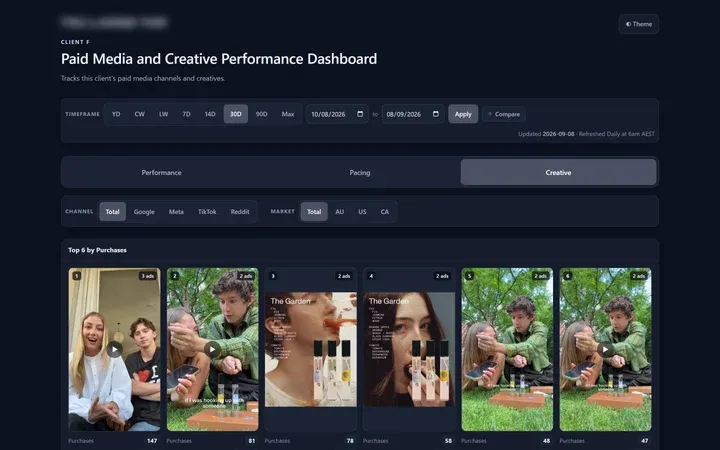
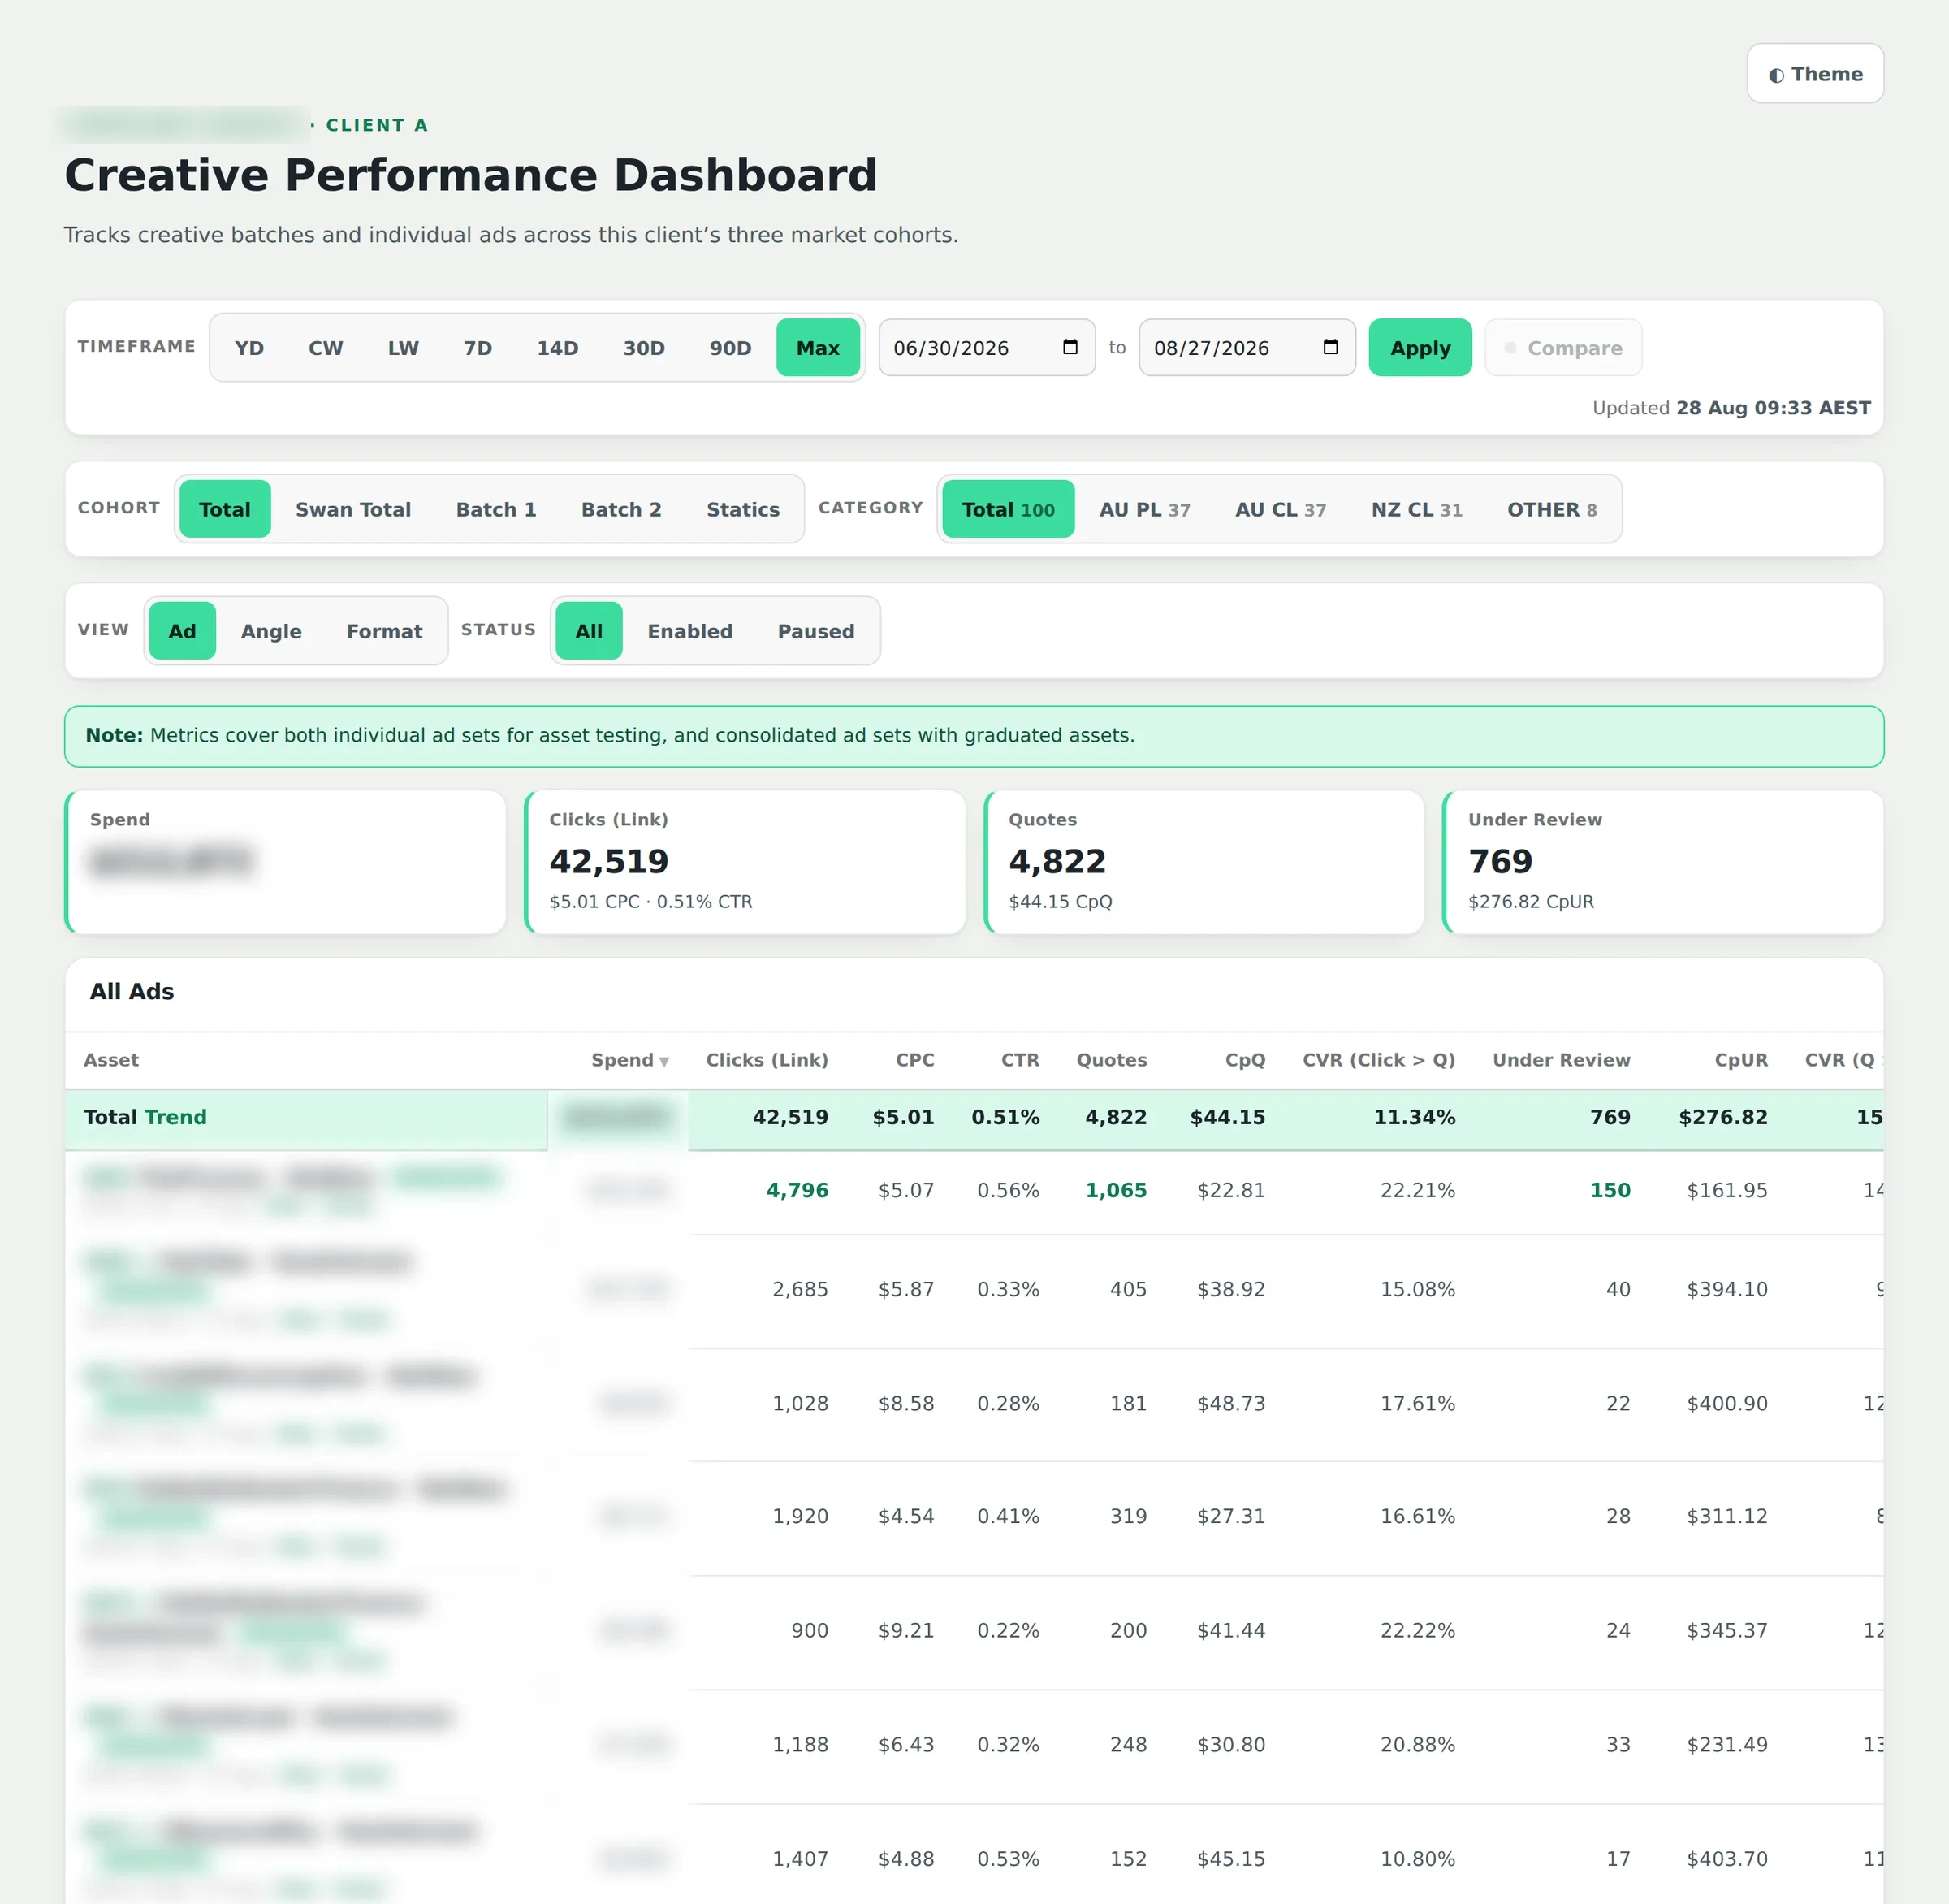
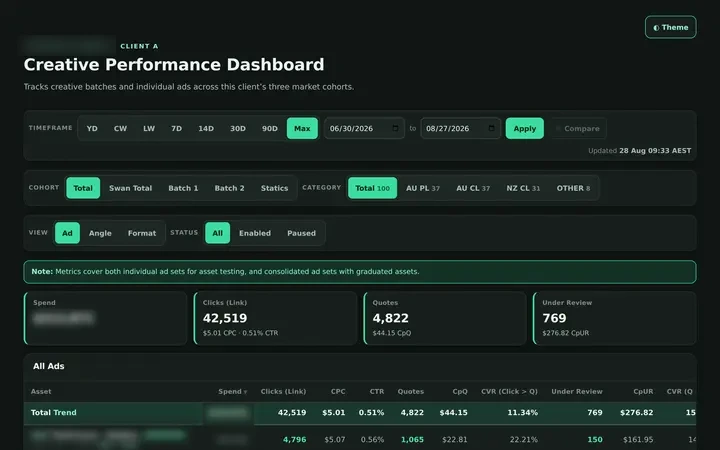
Every ad the client is running, ranked, with what it costs and what it brings back. Clicks, cost per click, click-through rate, quotes and cost per quote, on one screen.
The top row is the answer. The agency can see which creative is carrying the account before the client asks, and the client can see it without being walked through a spreadsheet.
Live client dashboard, every ad ranked.
Where this actually got to
The creative analytics subscription is gone The third party creative tool was decommissioned and its reports rebuilt directly on the warehouse. The weekly creative digests now post from the agency's own data instead of a product it was renting.
The weekly AI summaries are switched off Nine per client insight flows sit inactive. That was the agency's call and it was the right one. A shallow summary nobody sends a client is worse than nothing.
The spreadsheet is not retired yet The trend grid now reproduces the sheet's paid media sections under the sheet's own colour rules. That is the step that makes retirement possible. It is not the same as done. Reddit still comes from the sheet, and the non paid sections were deliberately left out of scope.
The dashboards are in daily use At the mid August check in, one of them was being shared with an end client every day. The build order for the rest is set by the agency's own feedback rather than by us.
What is still a person's job, deliberately
None of this decides anything for you. It shortens the distance to the decision.
Reading the trend and deciding whether it is a problem
Choosing what to change in an account
Everything the client conversation itself is for
Running the same report once per client?
If your reporting is one spreadsheet per client, and the history only lives inside it, this is the shape of the way out. We build the warehouse first and the dashboards on top of it.