Client system · Sales dashboard
Sales Performance Dashboard
An Australian property investment advisory sells through a four-stage sales pipeline. The stages lived in one system, the meeting outcomes in another, and the numbers in whichever spreadsheet was last stitched together. We built the one screen the team now opens.
Financial services · property investment
7 live views
The dashboard, four views
Who is moving deals
Per-agent conversion, side by side, without exporting anything.
1 / 4
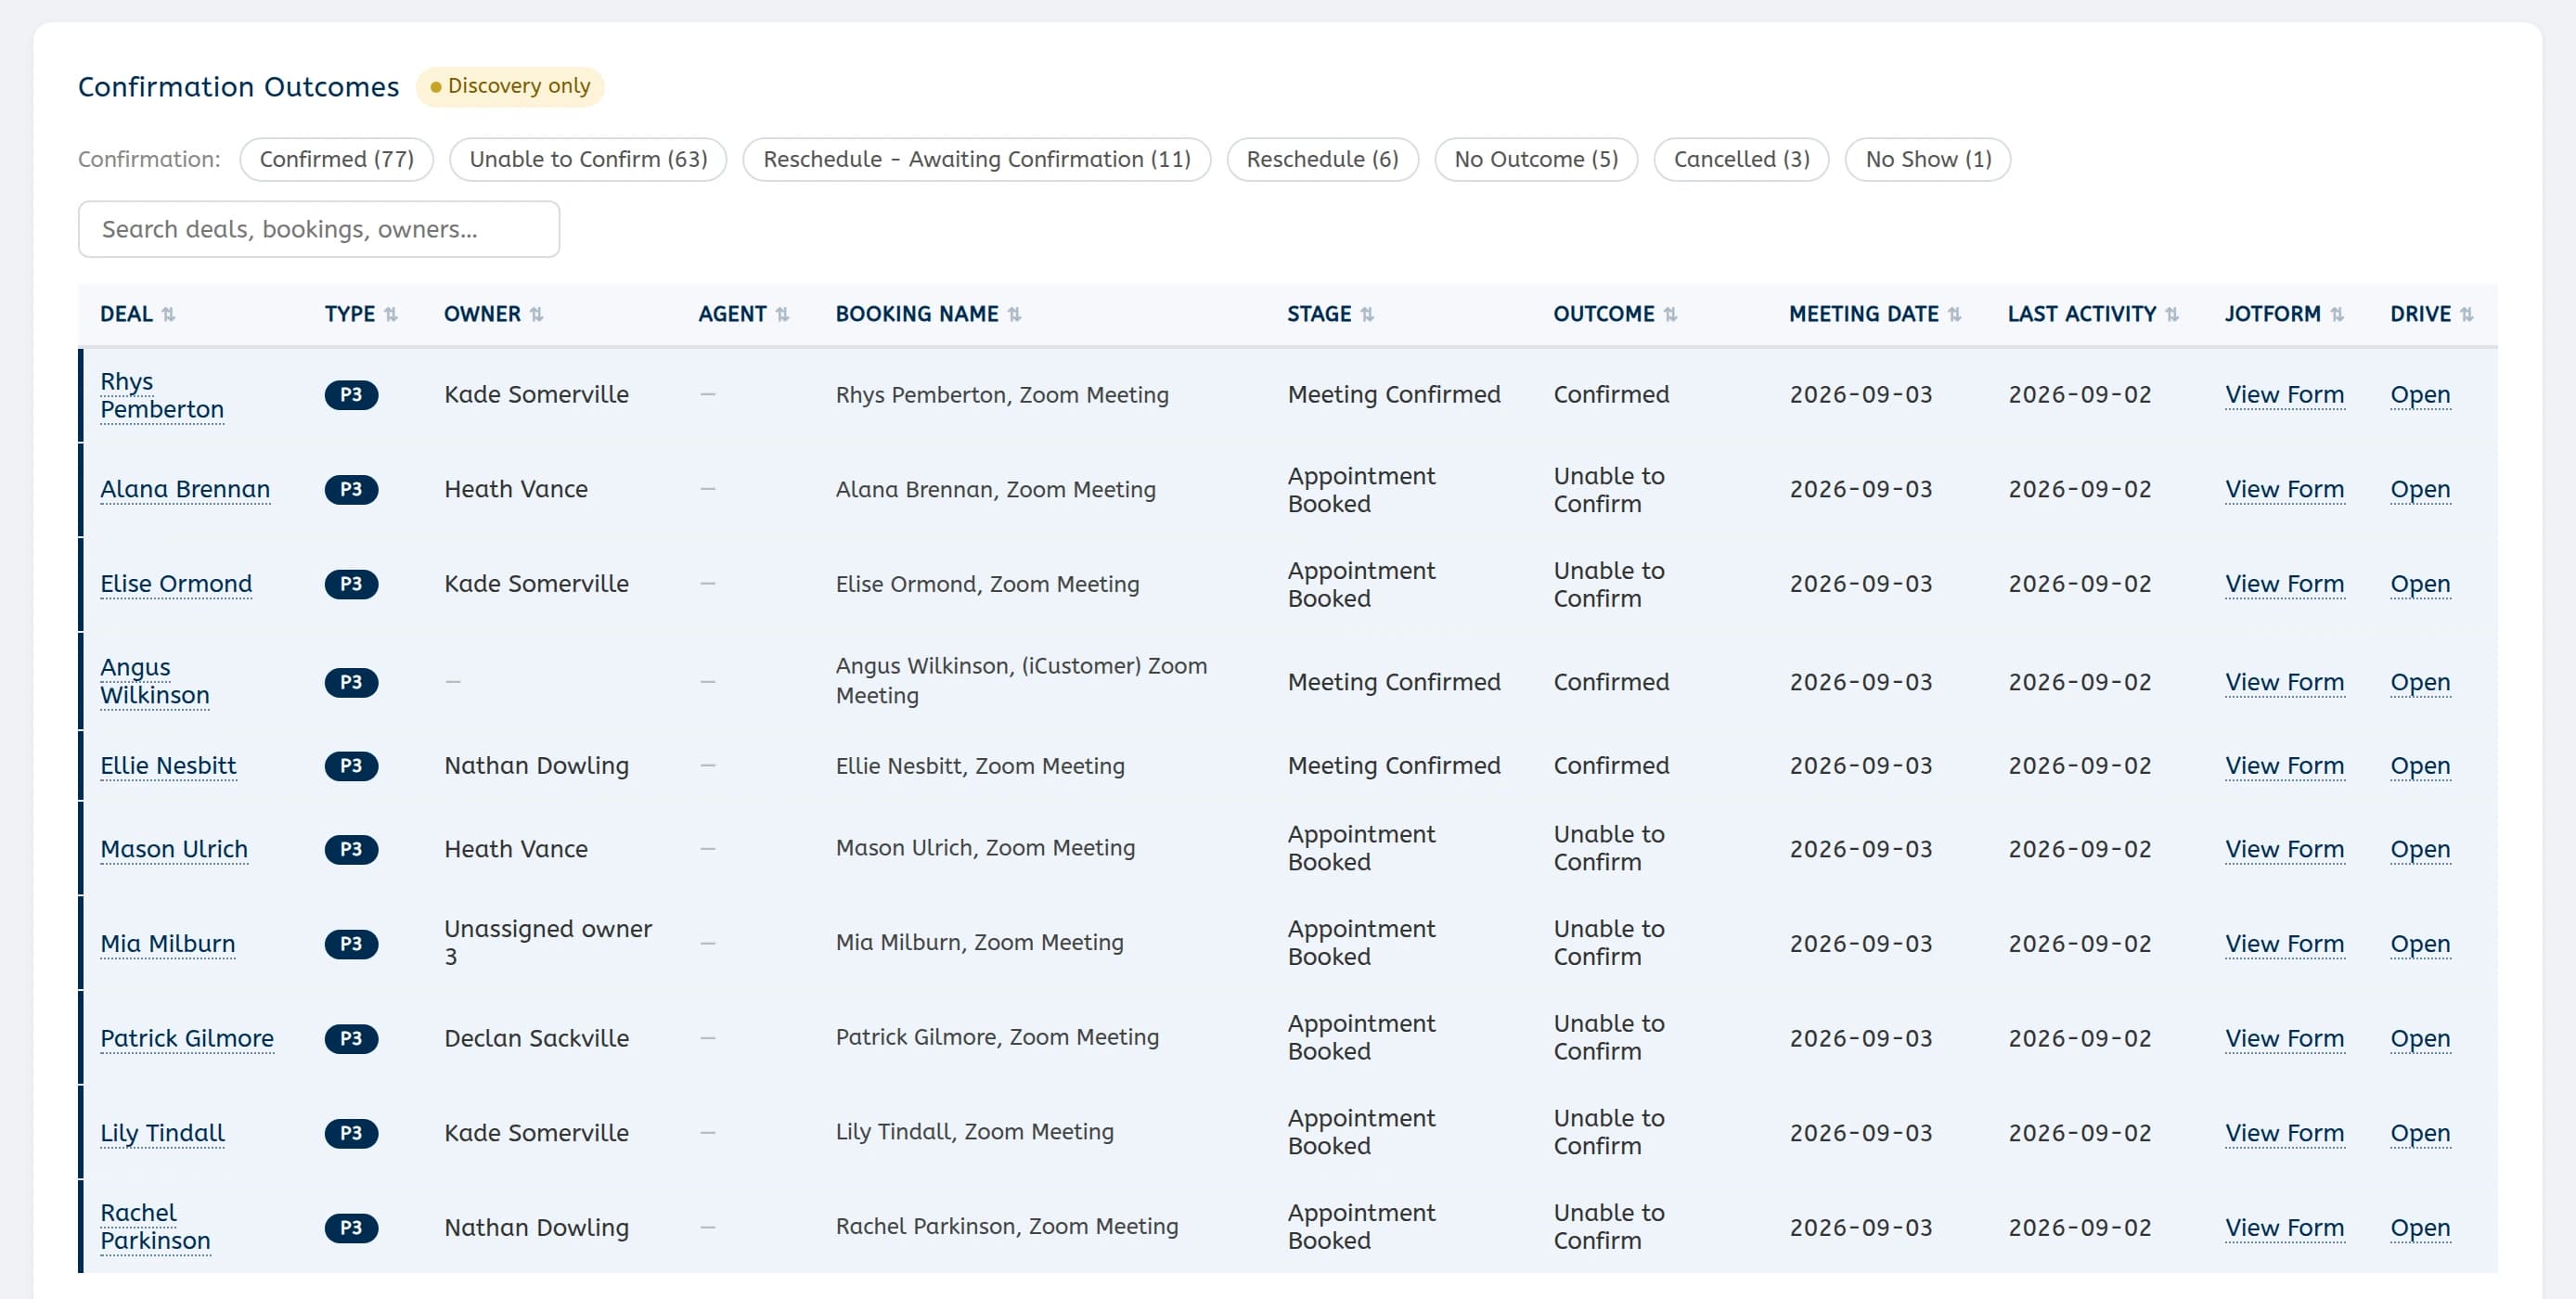
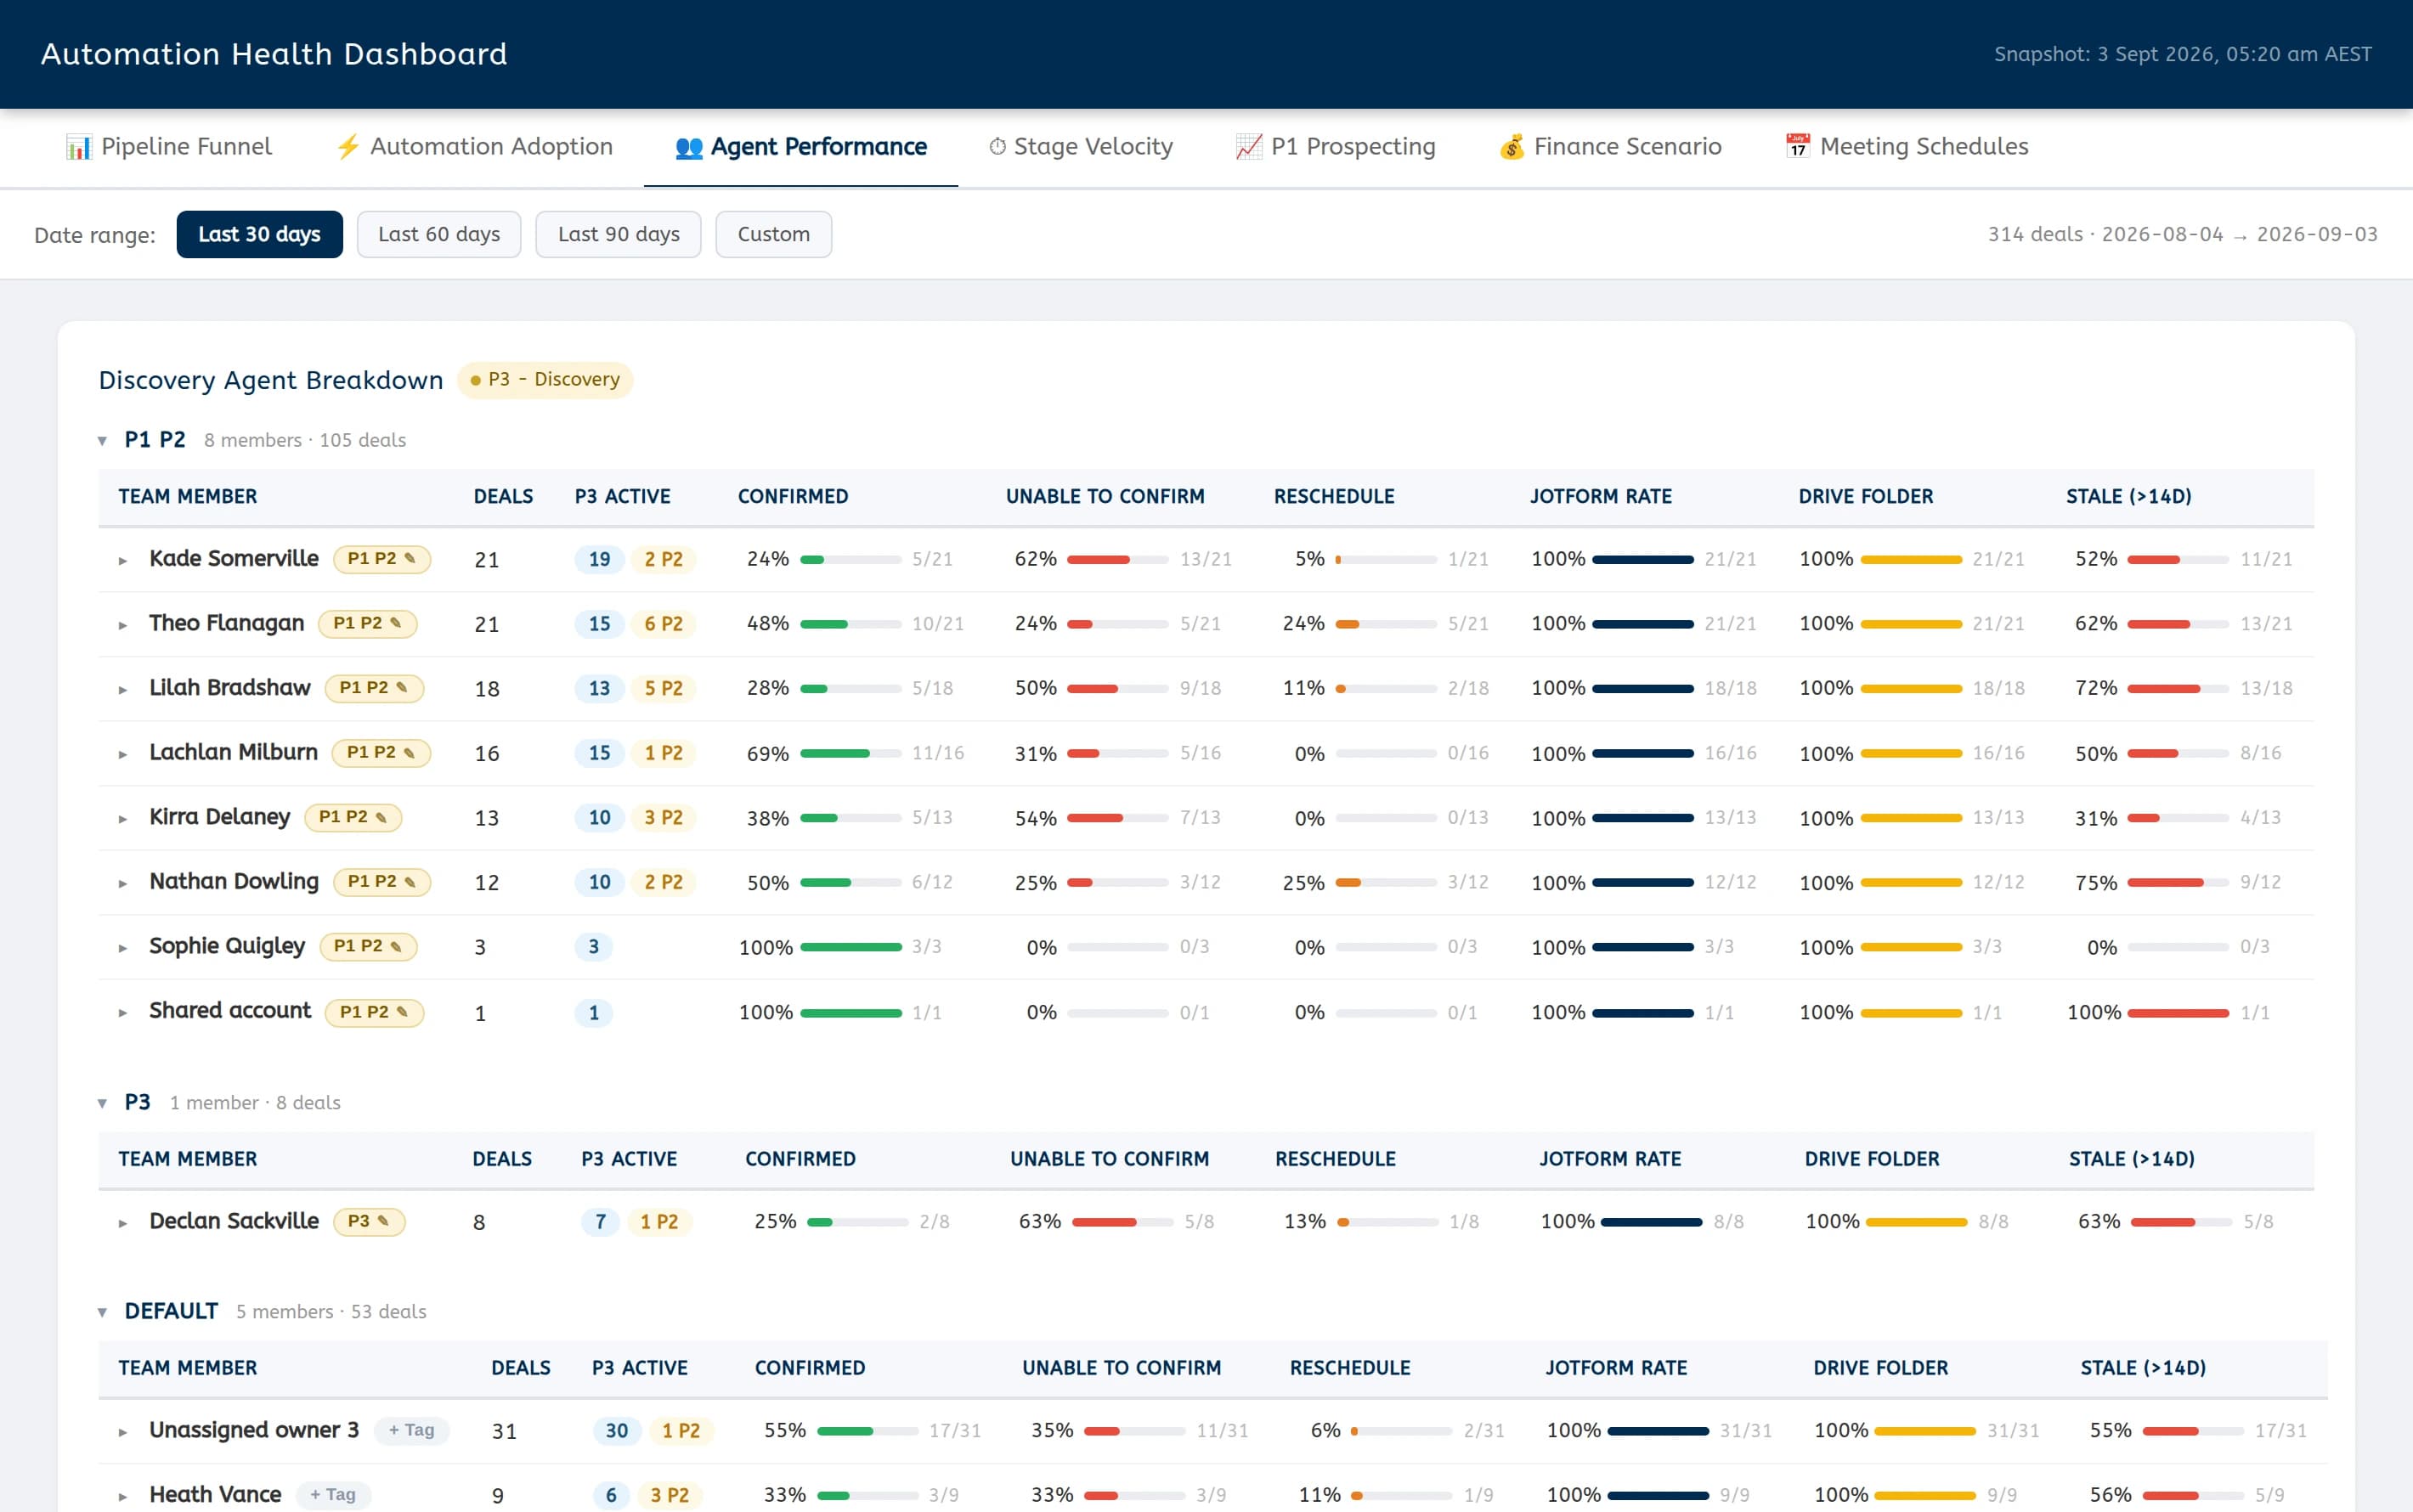
Agent Performance · the live dashboard
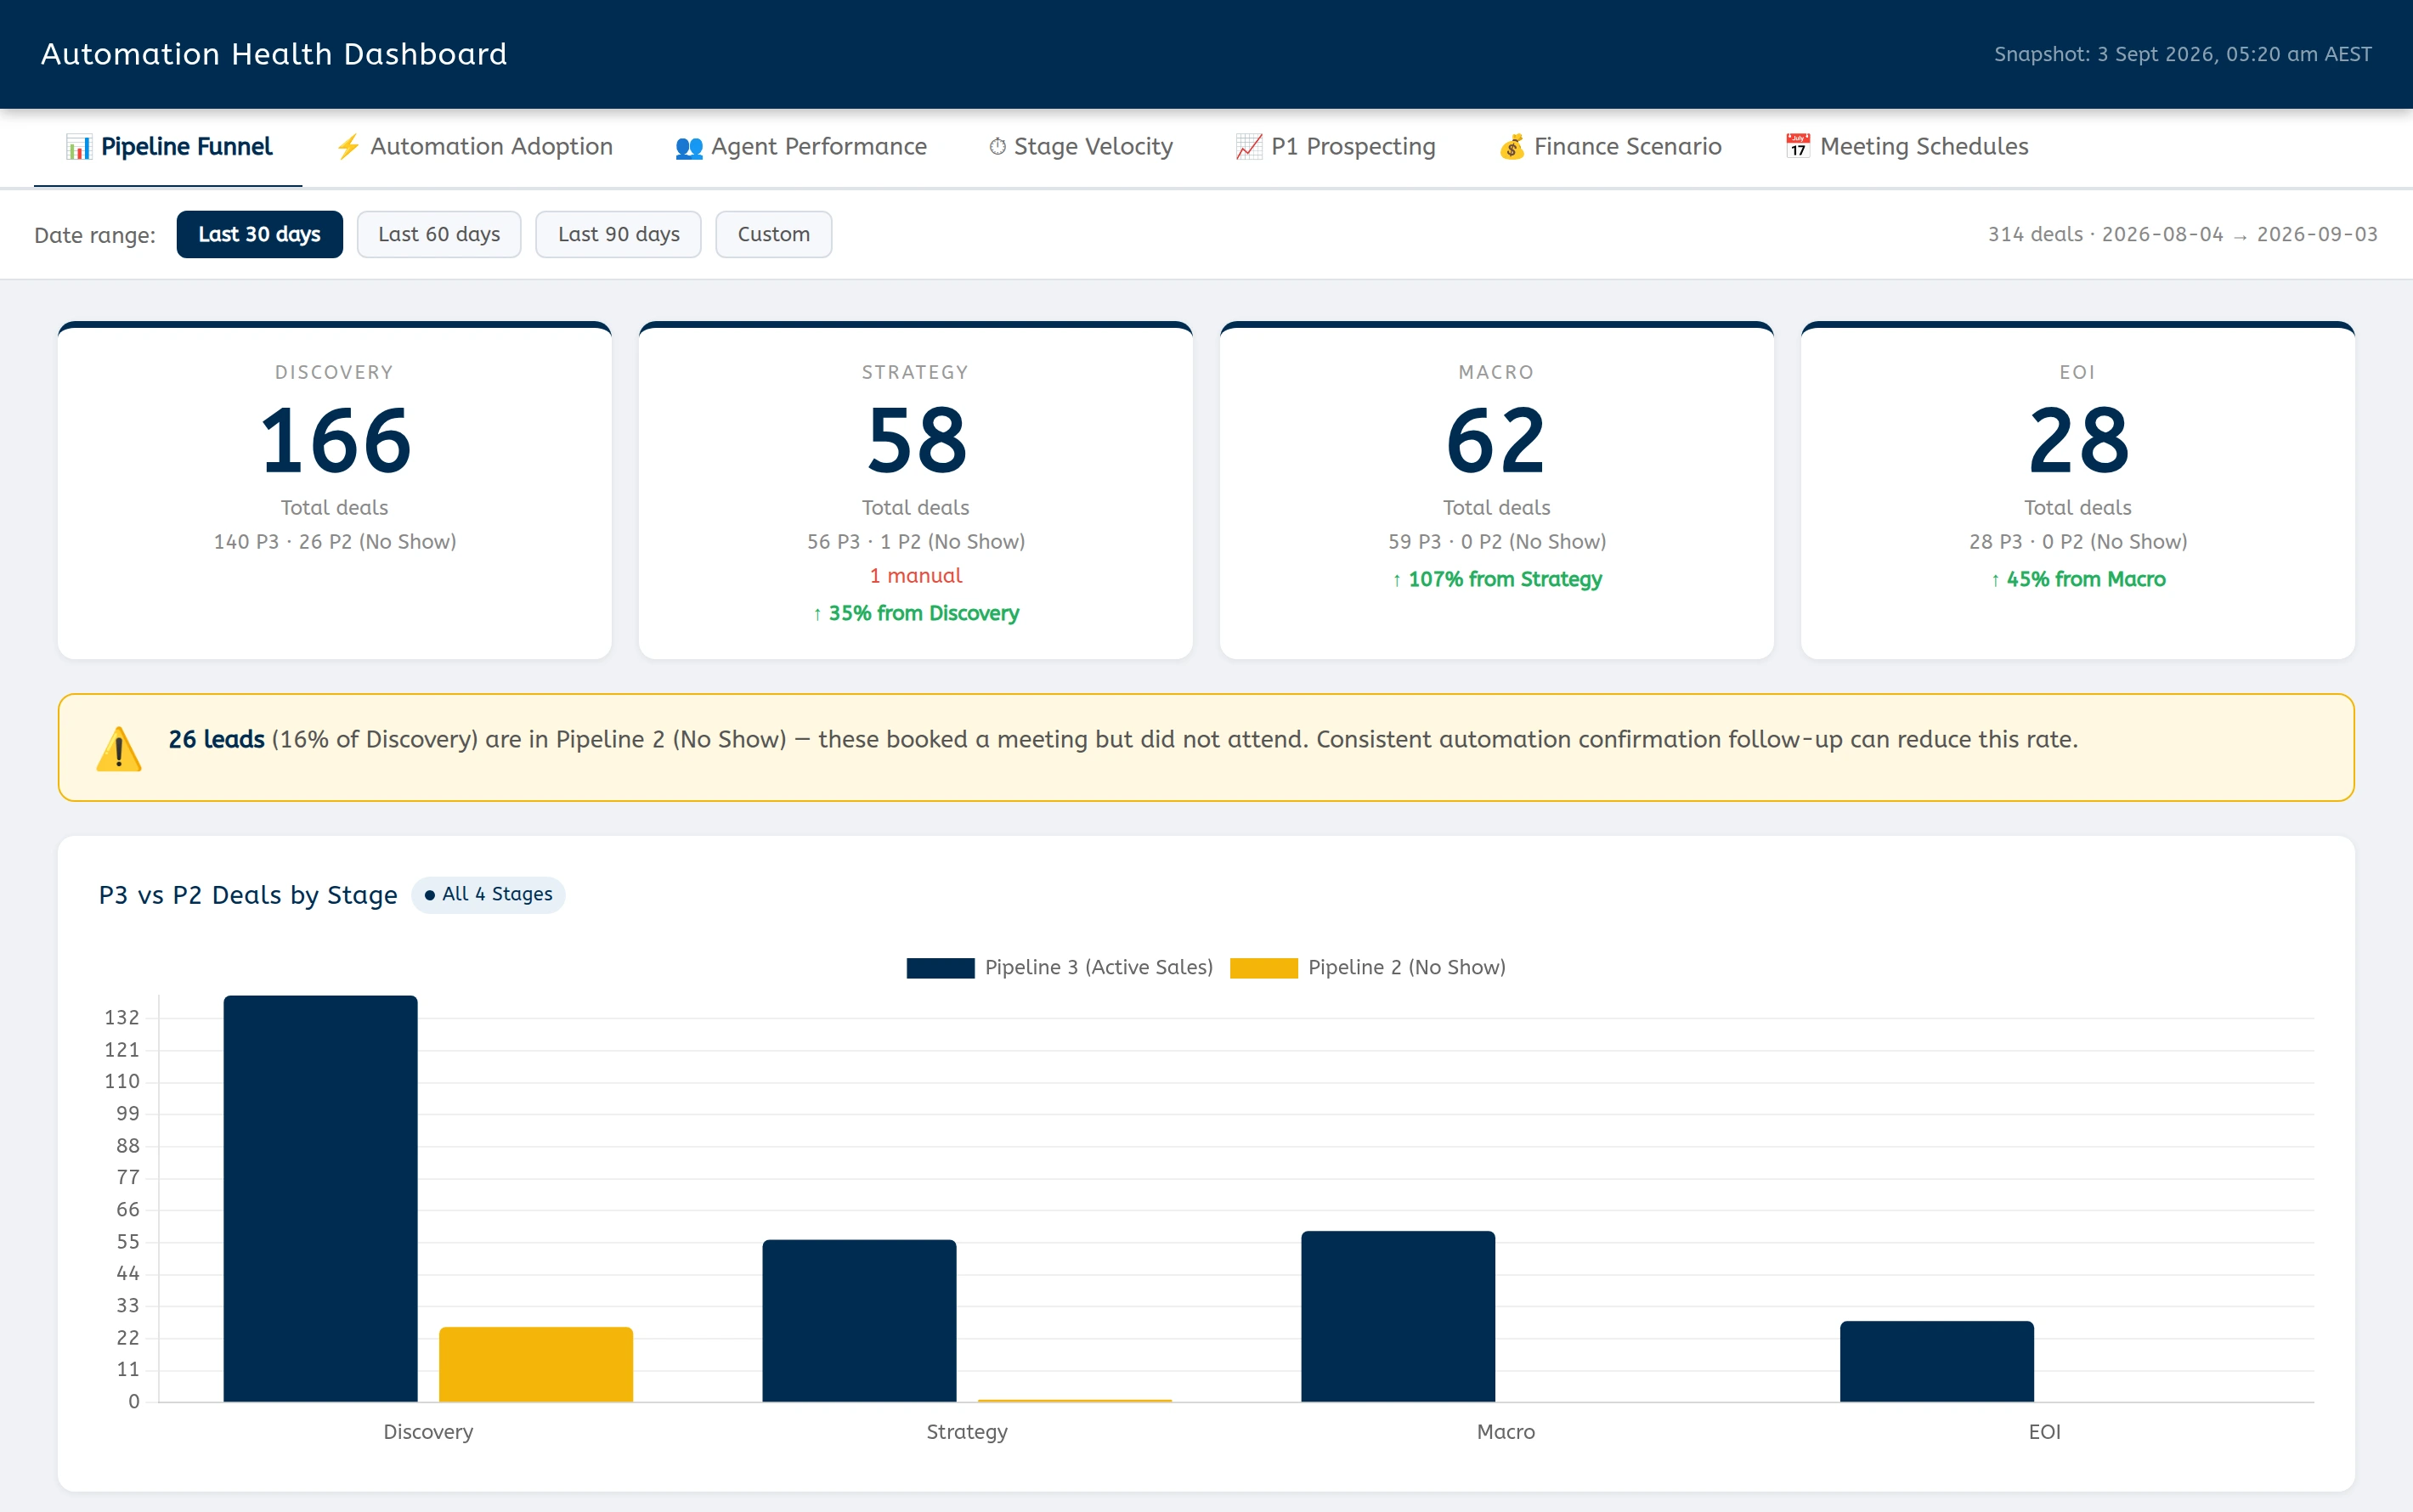
Pipeline Funnel · the live dashboard, 30-day window
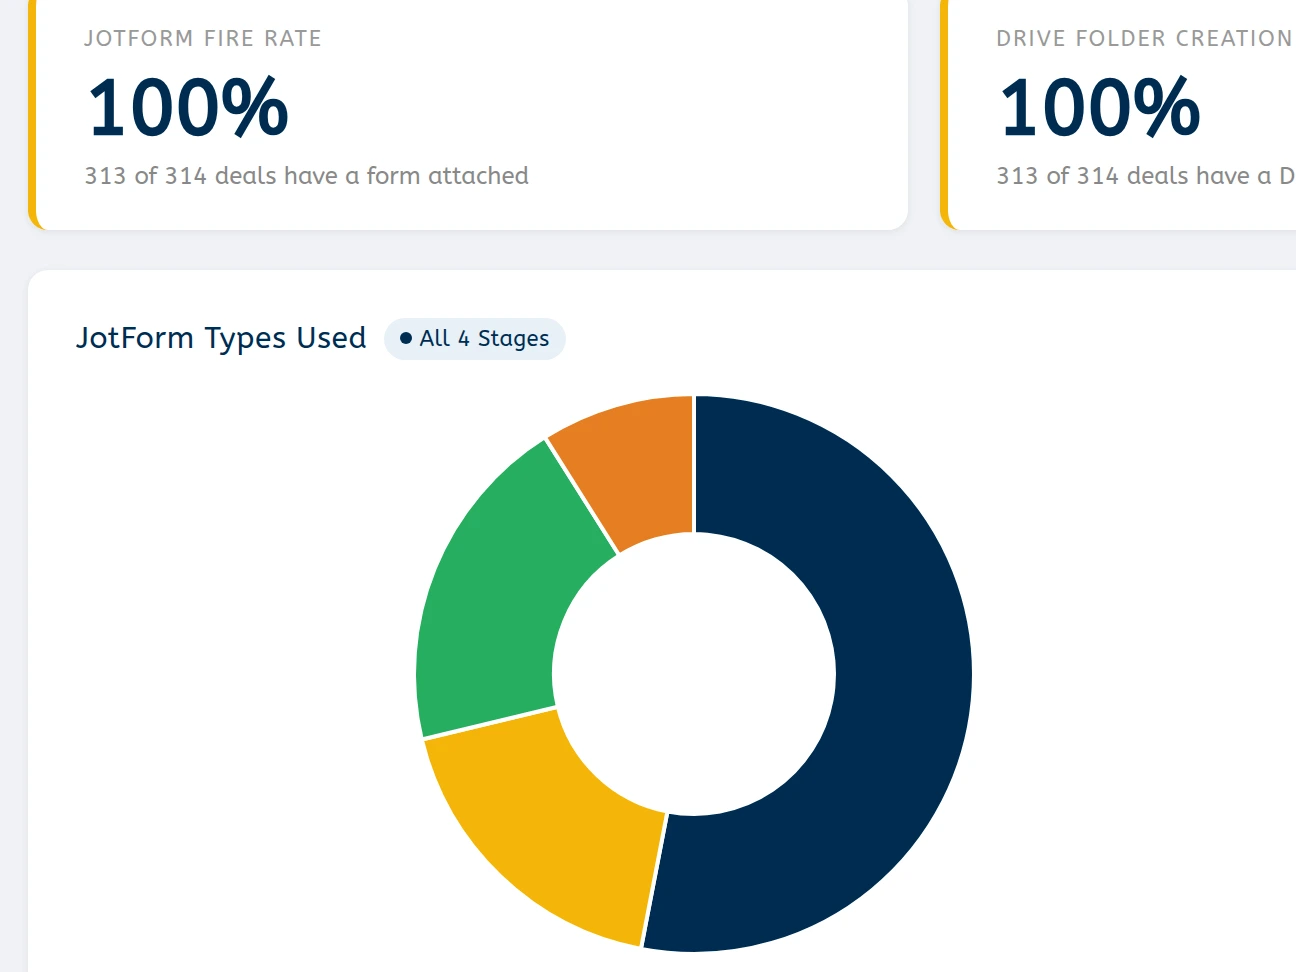
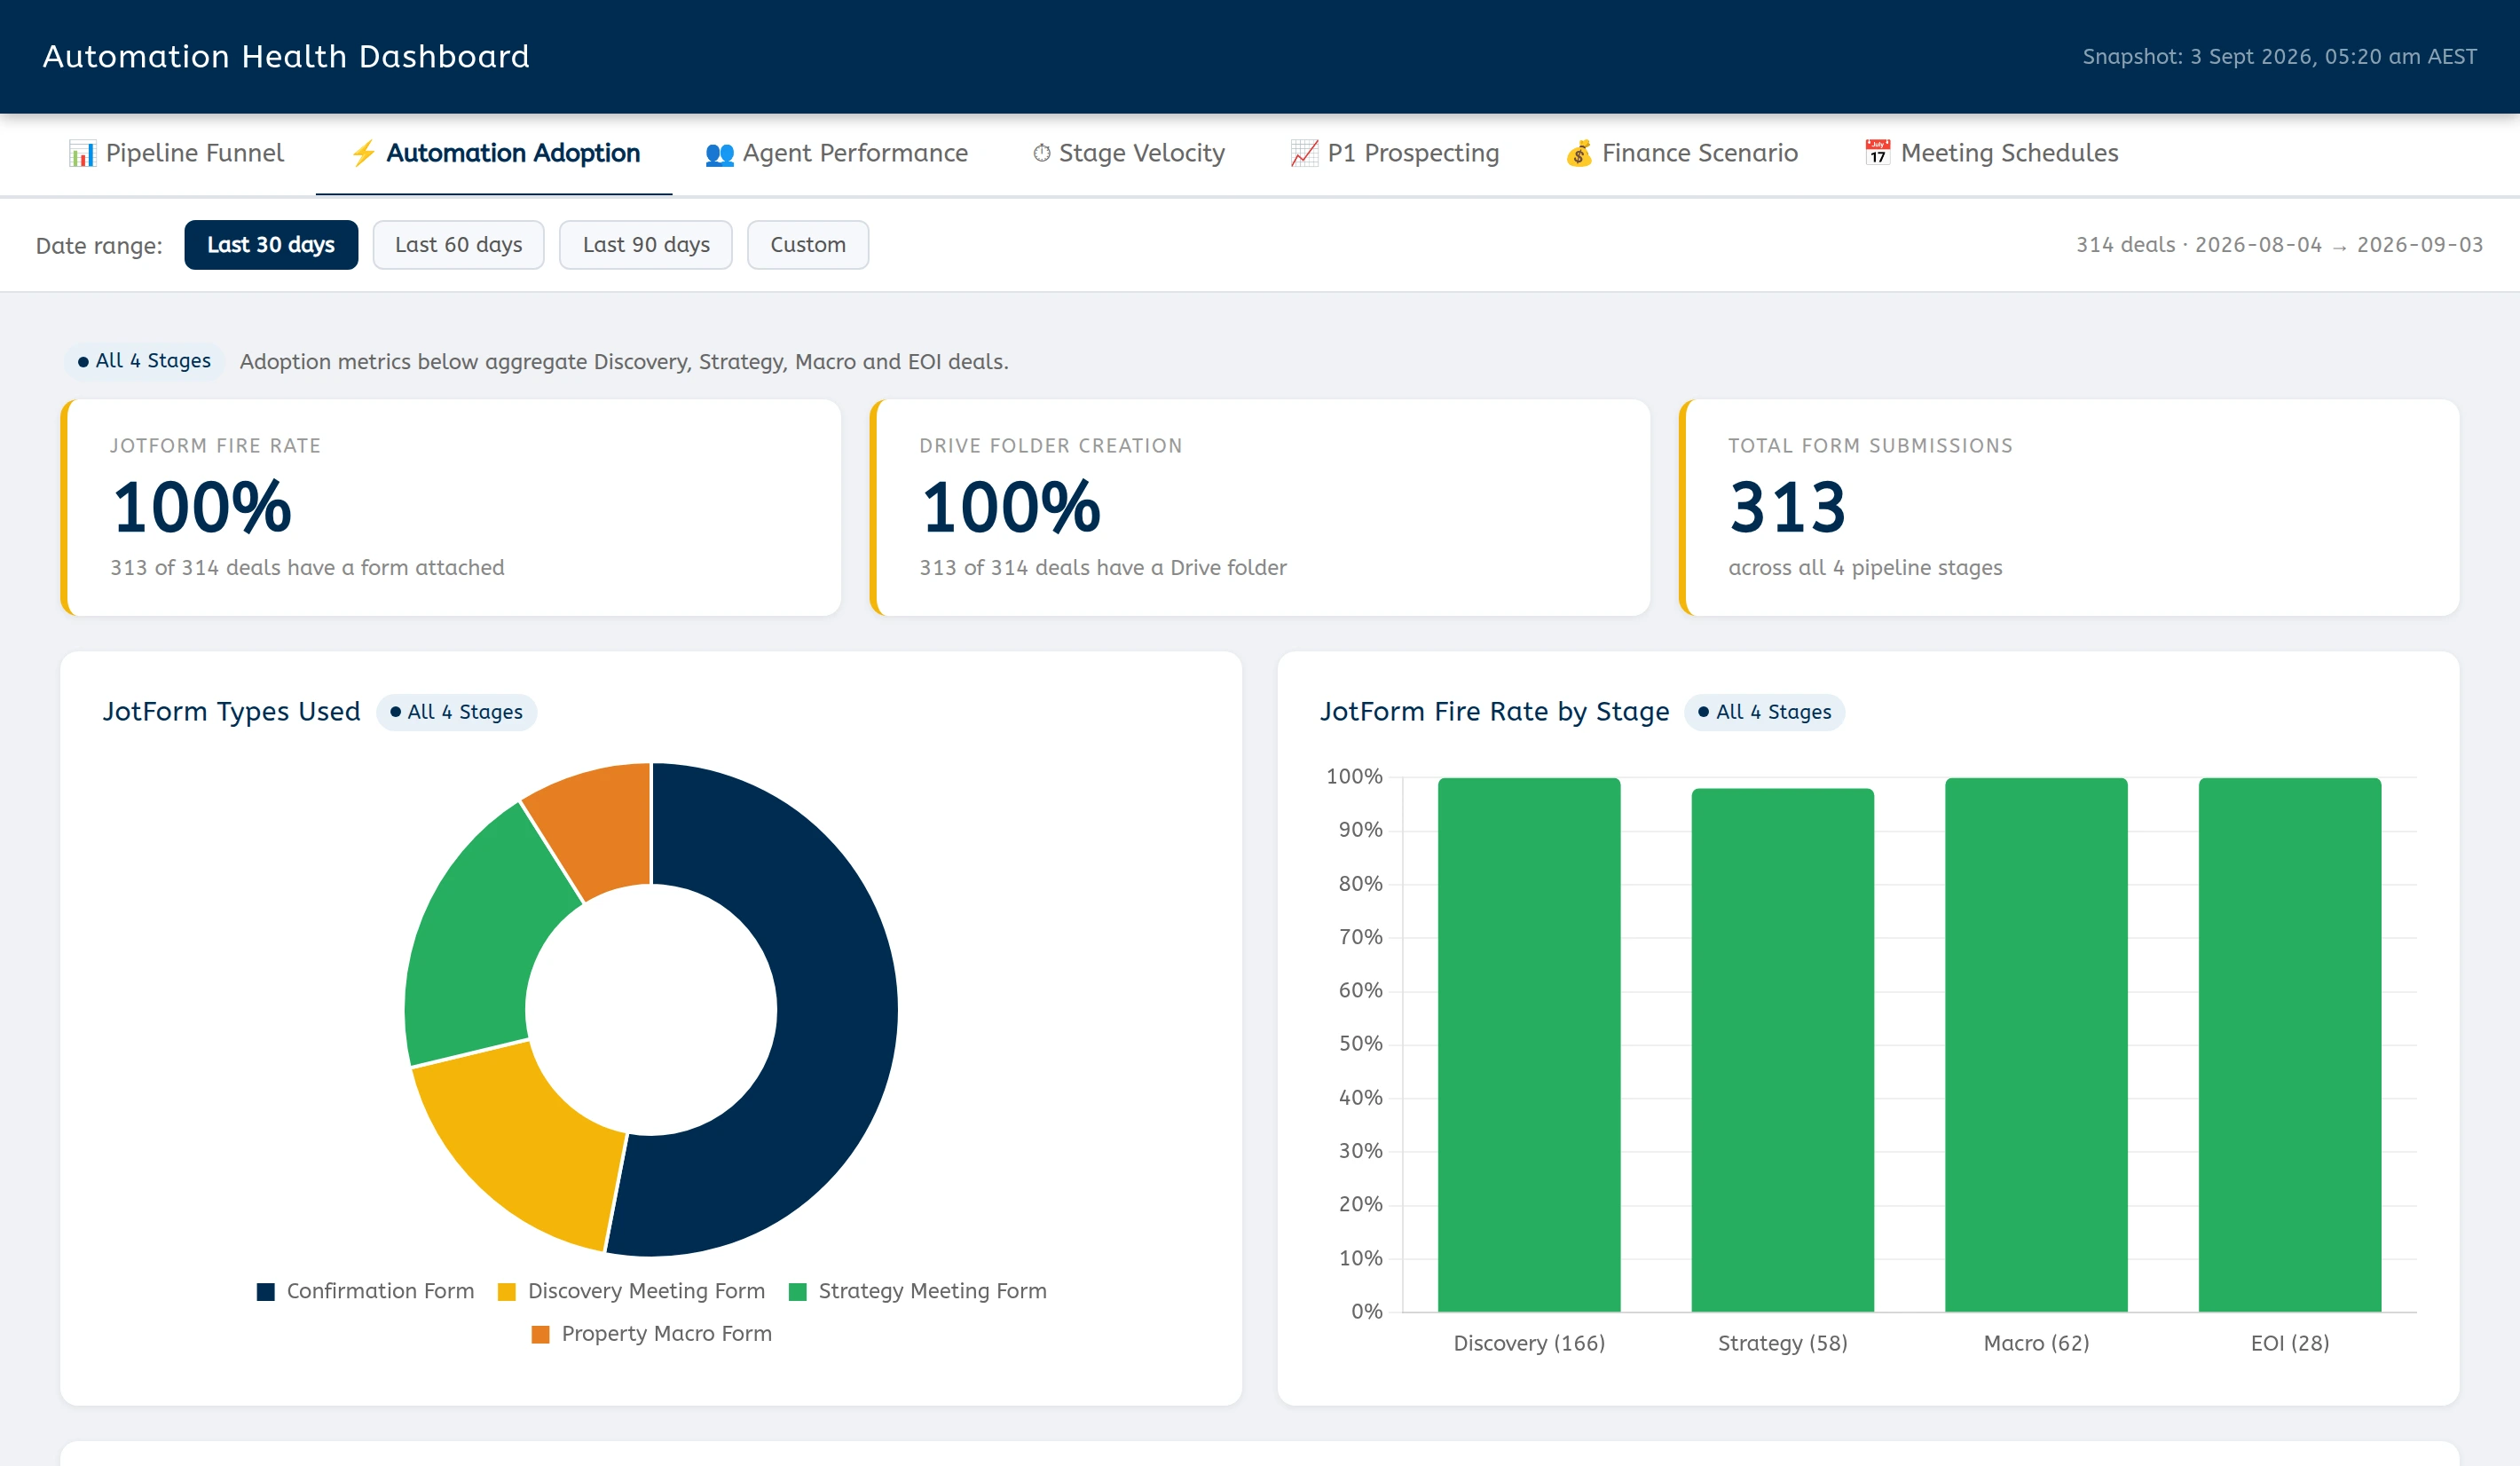
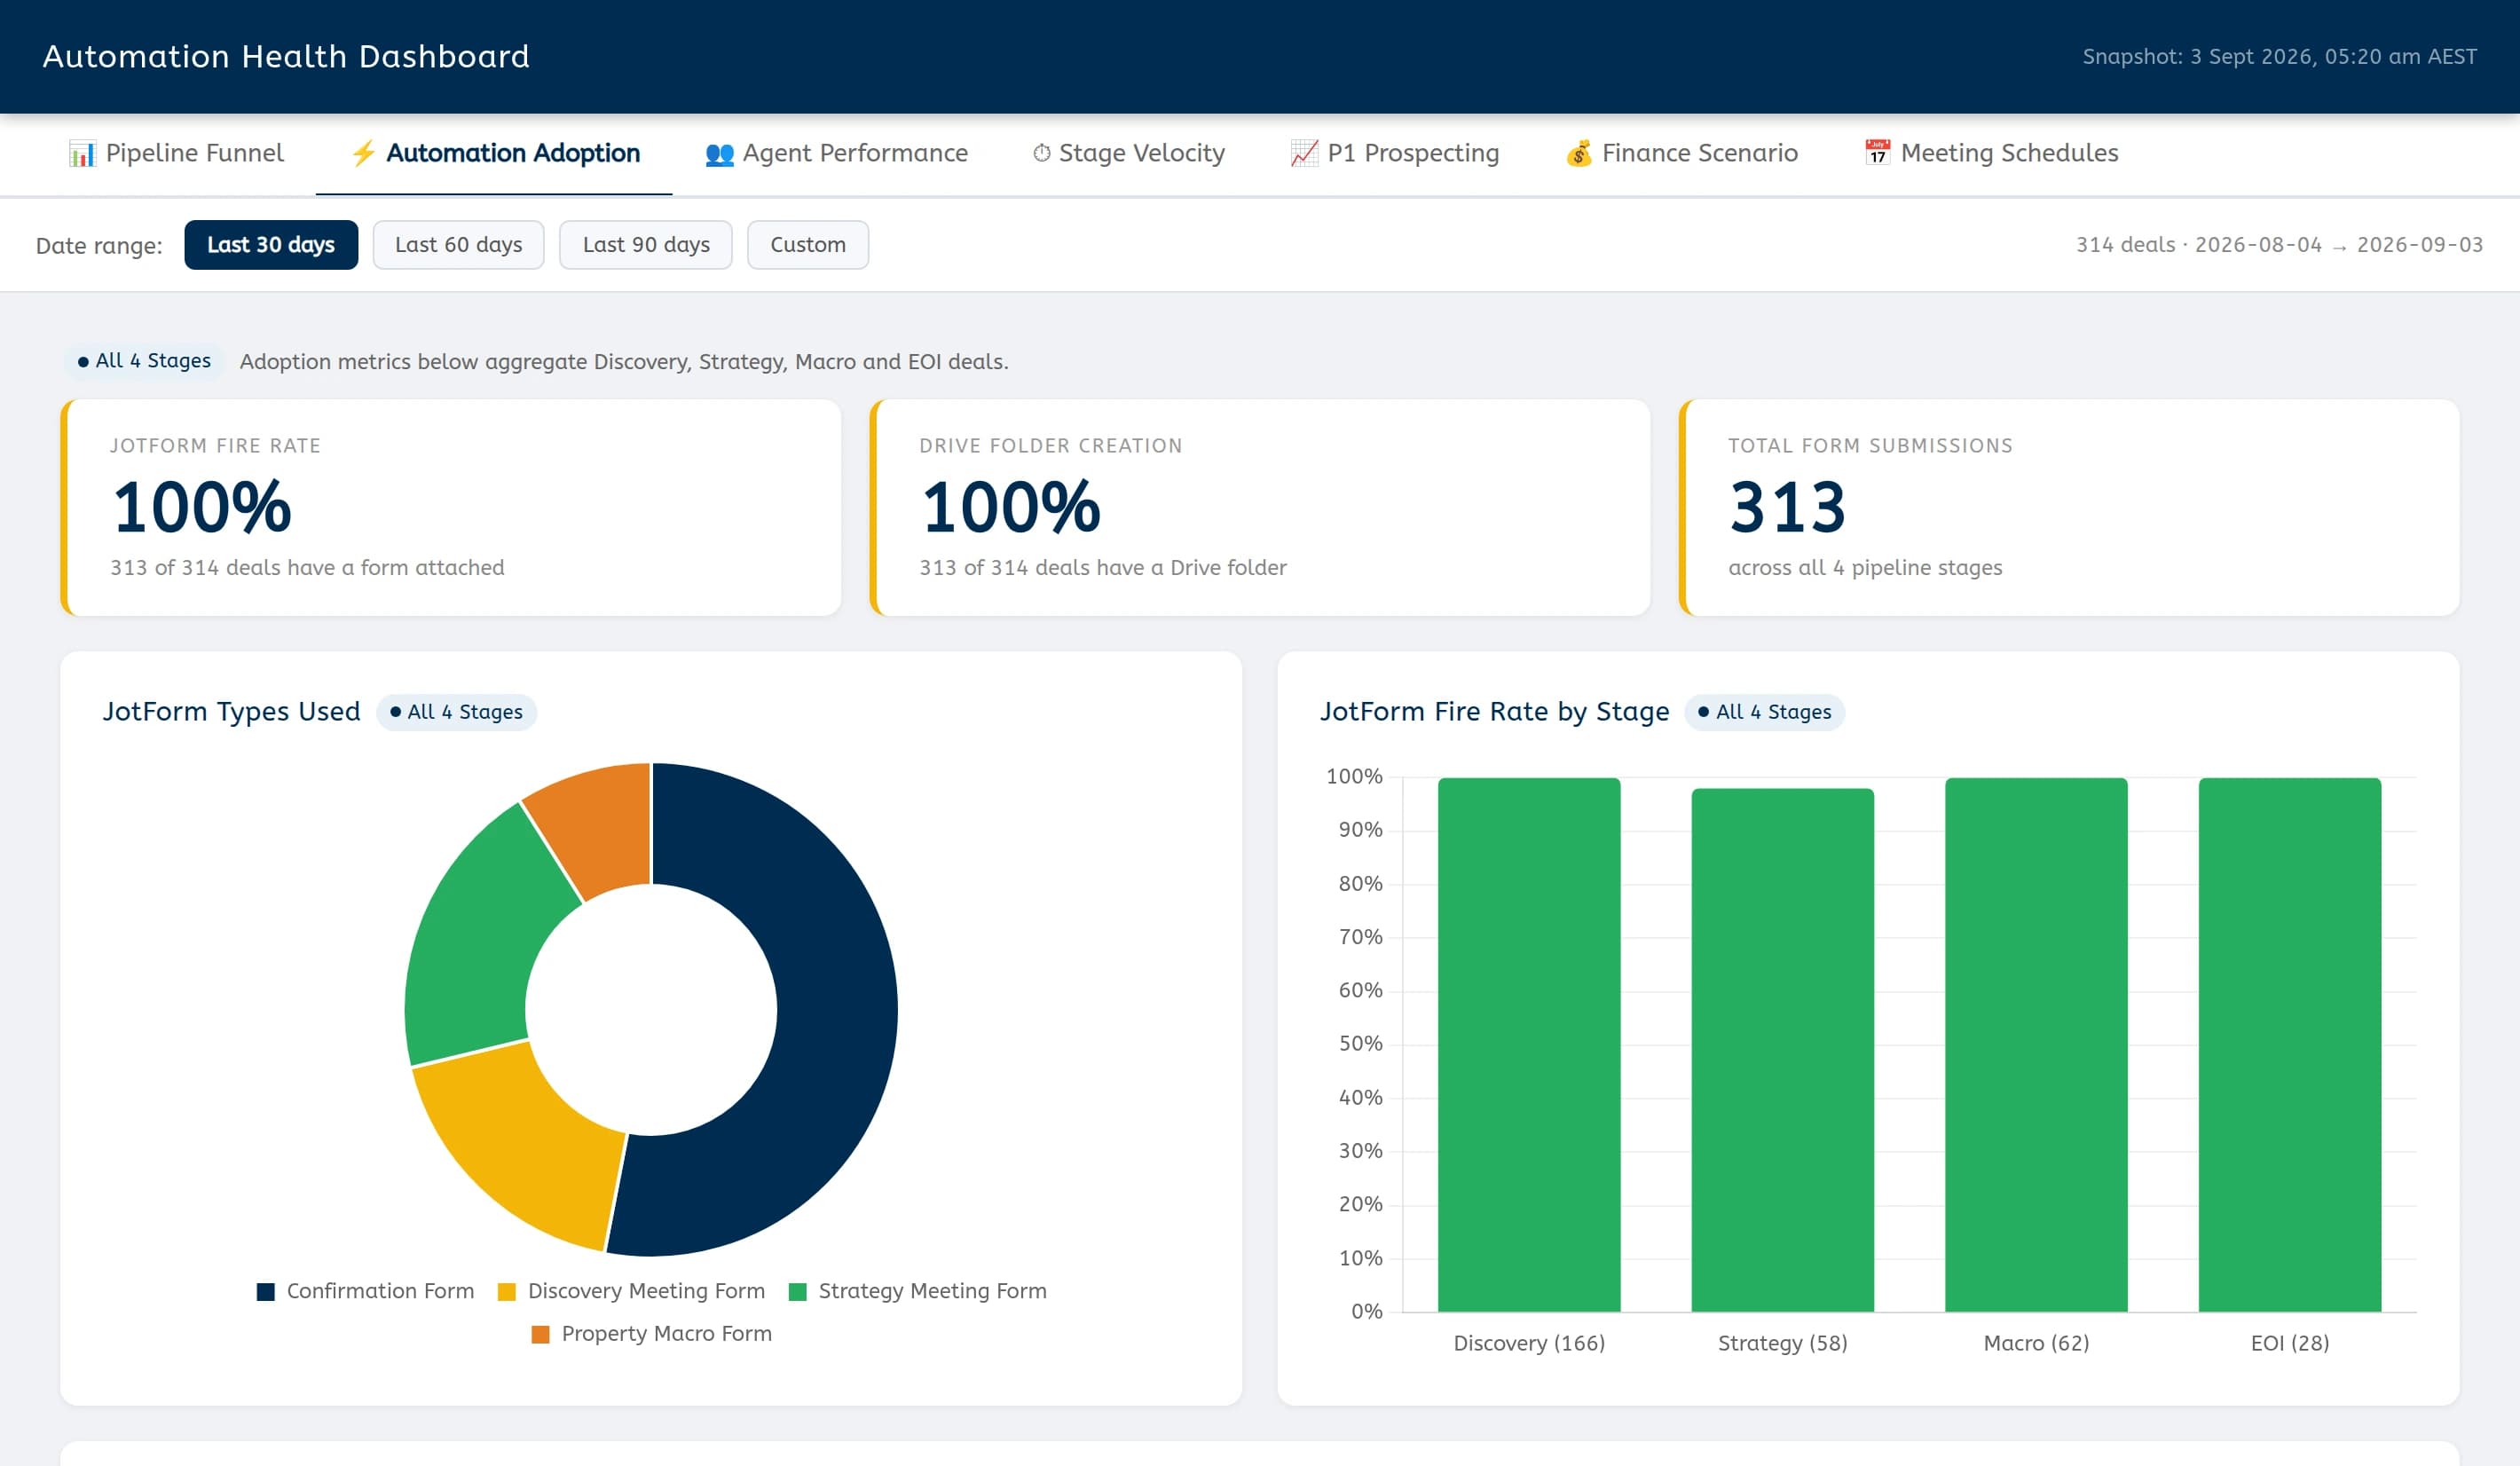
Automation Adoption · the live dashboard
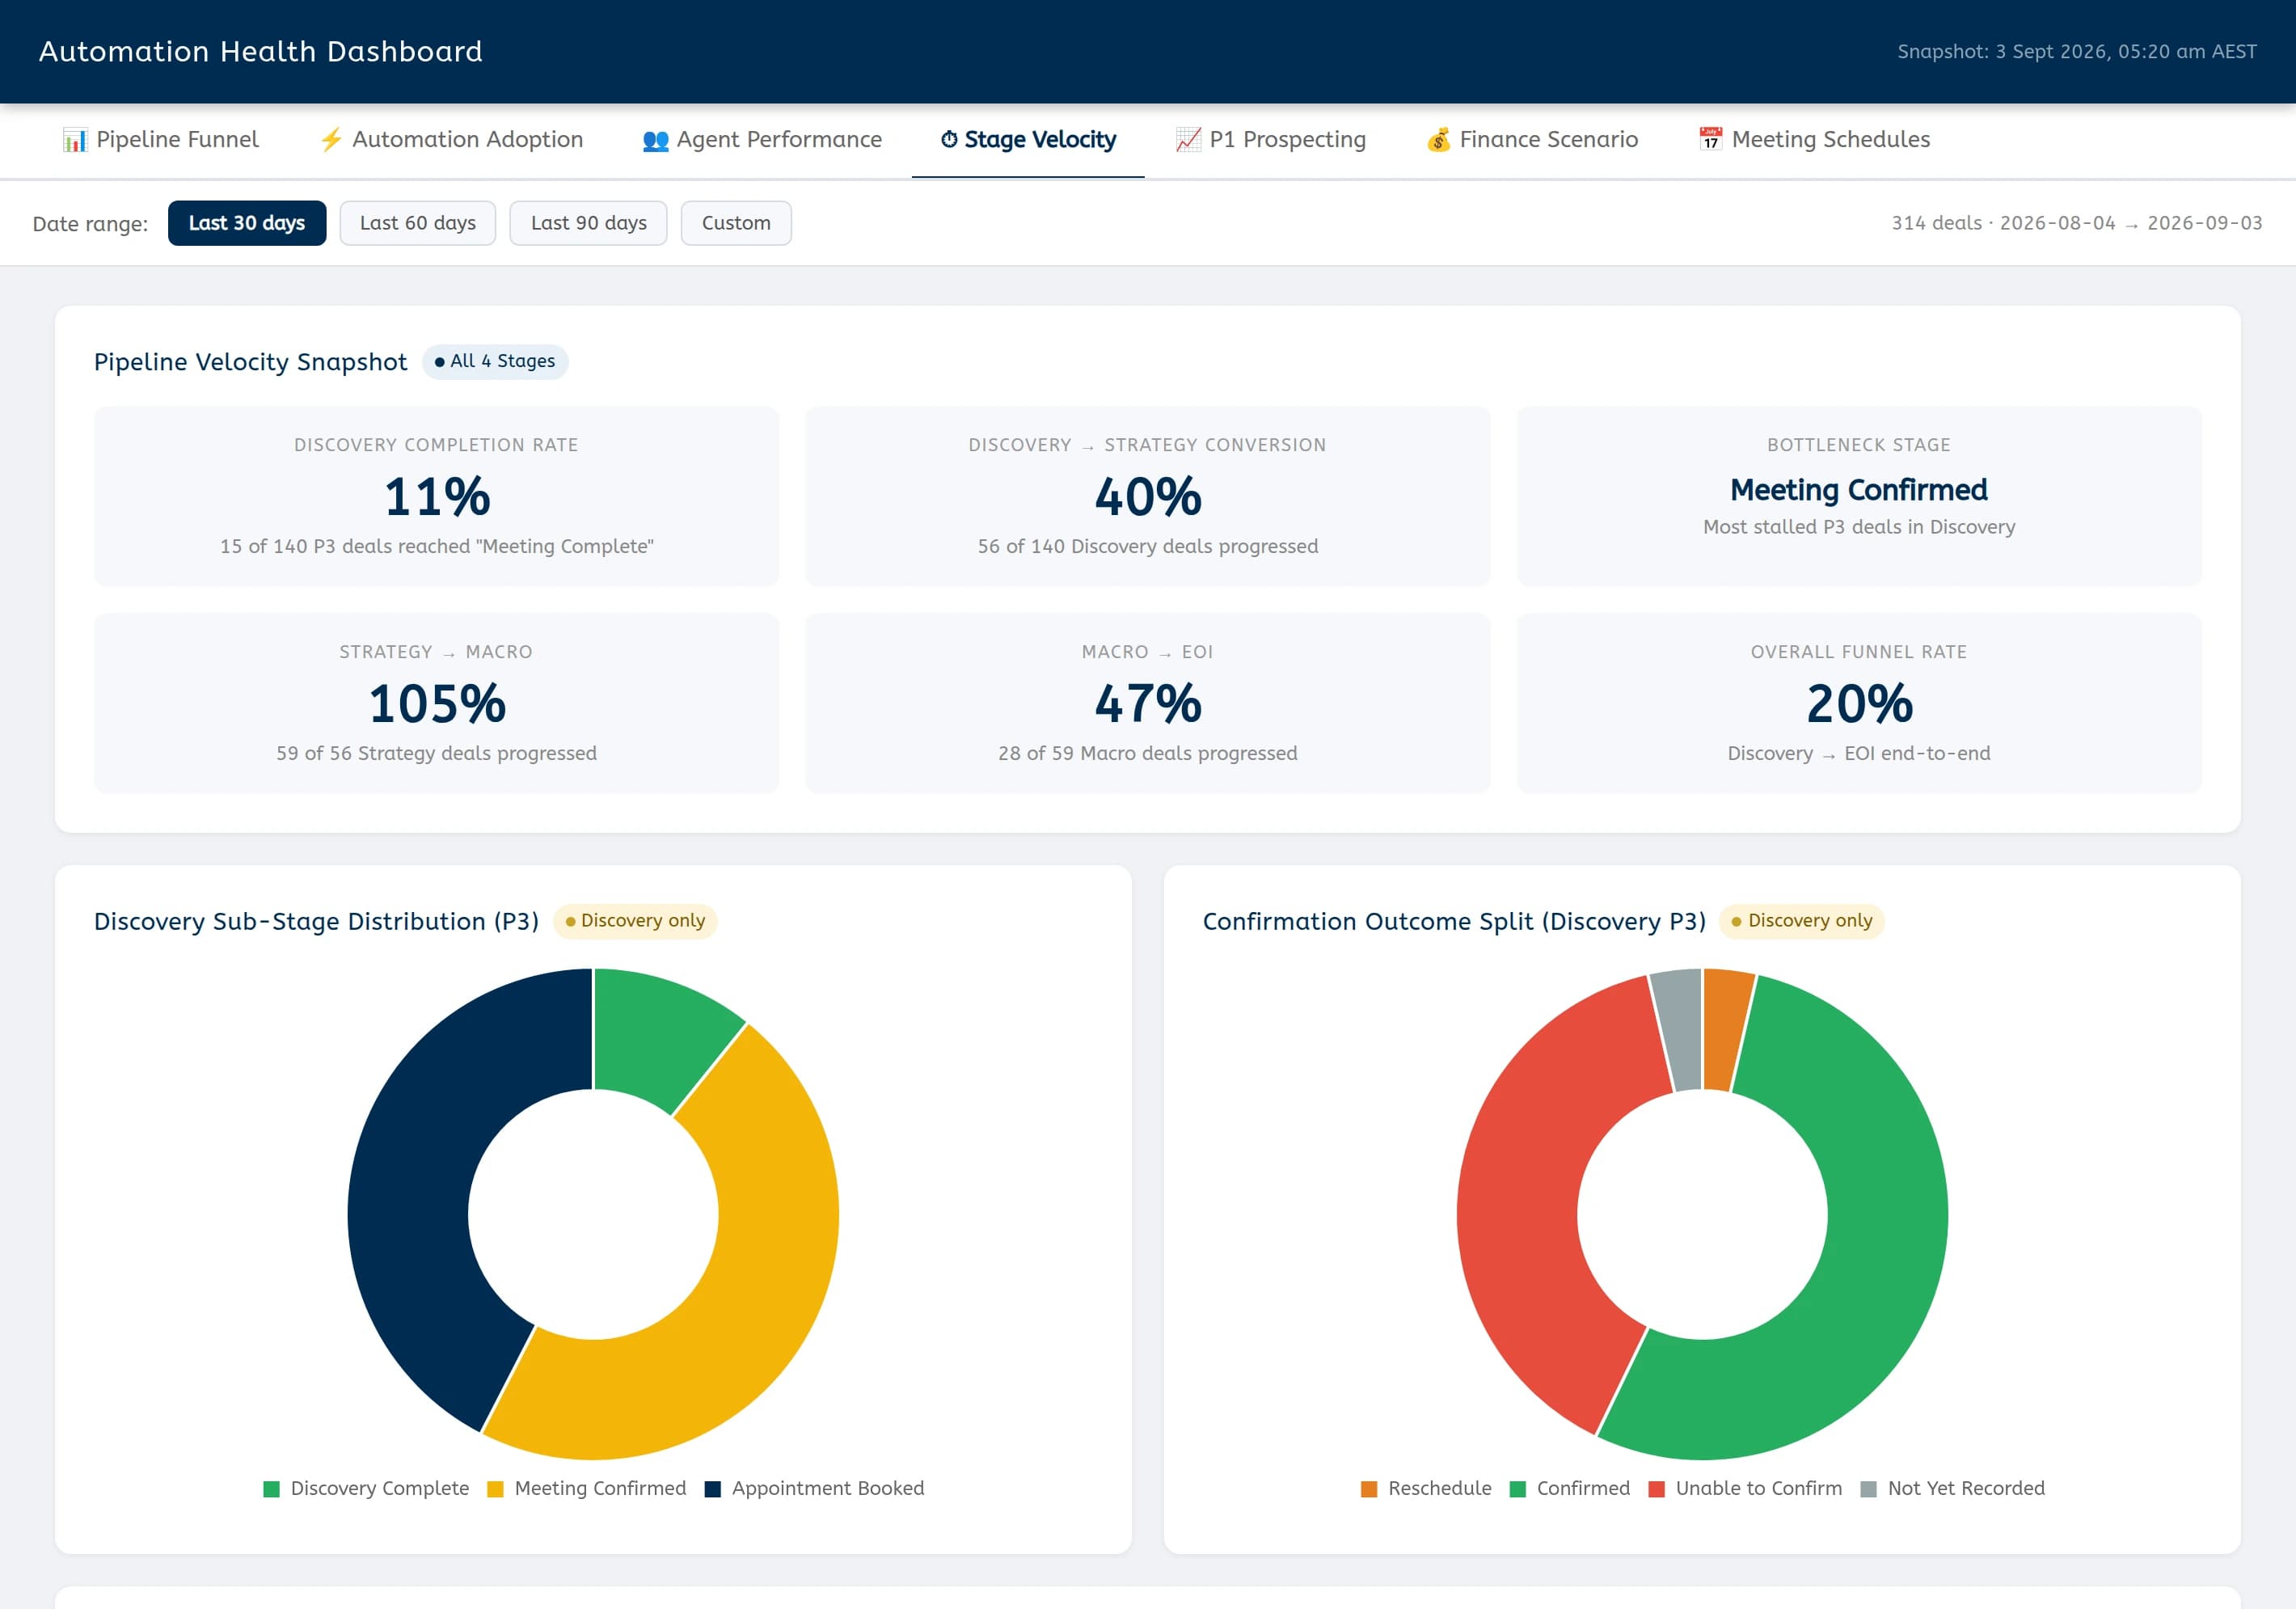
Stage Velocity · the live dashboard
Nobody could read the week until it was over
Deals sat in HubSpot. Meeting outcomes arrived by JotForm. Bookings lived in Google Calendar, documents in Drive. The number anyone actually wanted lived in whichever spreadsheet had last been stitched together by hand.
So a stalled deal looked exactly like a healthy one. A form that never fired, or a folder that was never created, stayed invisible until someone went looking, usually weeks later, because something had already gone wrong.
The ask was not another report. It was one screen, current the moment it loads, that answered the questions the team kept re-answering by hand.
One application
Seven views, one screen
Every tab reads the same live pipeline. The team changes view; nobody changes system, and nobody rebuilds a spreadsheet to ask a different question.
Automation health
Did the paperwork actually happen?
Every deal in this pipeline is supposed to end up with a form attached and a folder created. Before the dashboard, the only way to know was to open the deal.
Now it is a number on the screen. In the current 30-day window, 313 of 314 deals carry both — and the one that does not is findable in a click rather than a quarter.
Automation Adoption · the live dashboard
The questions it had to answer
We started from the questions the team asked most often, not from the data that happened to be easiest to export.
Where is every deal right now? Four stages across two pipelines, and no single place that counted them.
Did the automation actually fire? A missing form or folder was invisible until someone went hunting for it.
Who is carrying the load? Per-agent performance meant an export and a pivot table, every time.
What has gone quiet? Idle deals and stalled finance requests surfaced at month end, not on the day.
Where the pipeline actually goes
The funnel is the first thing on the screen because it is the first question in every meeting. The same window can be re-cut to 60 or 90 days without leaving the page.
The funnel, three ways
The counts
How many deals sit at each of the four stages, right now.
1 / 3
Pipeline Funnel · 30-day window
Pipeline Funnel charts · the live dashboard
Pipeline Funnel · 90-day window
Two pipelines, counted separately
Active sales and no-show are split on every stage, so a booked-but-missed meeting never inflates the funnel.
Stage-to-stage movement
Each card carries its change from the stage before it.
Re-cut on the spot
30, 60 and 90-day windows, plus a custom range.
Who is moving deals
The agent view puts every team member on the same row structure — deals carried, share confirmed, share unable to confirm, rescheduled, and how much of their book has gone stale.
Agent Performance · the live dashboard
One definition for everyone
The same window and the same stage rules apply to every row, so the comparison is fair.
Confirmation, not just volume
A high deal count with a low confirmation rate reads differently from a small, well-worked book.
What has gone quiet
The activity view is the one nobody asked for and everybody uses. It counts how long it has been since anything happened to a deal, which is usually the truest signal in the pipeline.
Deal Activity Health · the live dashboard
Median days since activity
One number for the whole book, rather than a feeling about it.
Stale and cold, separated
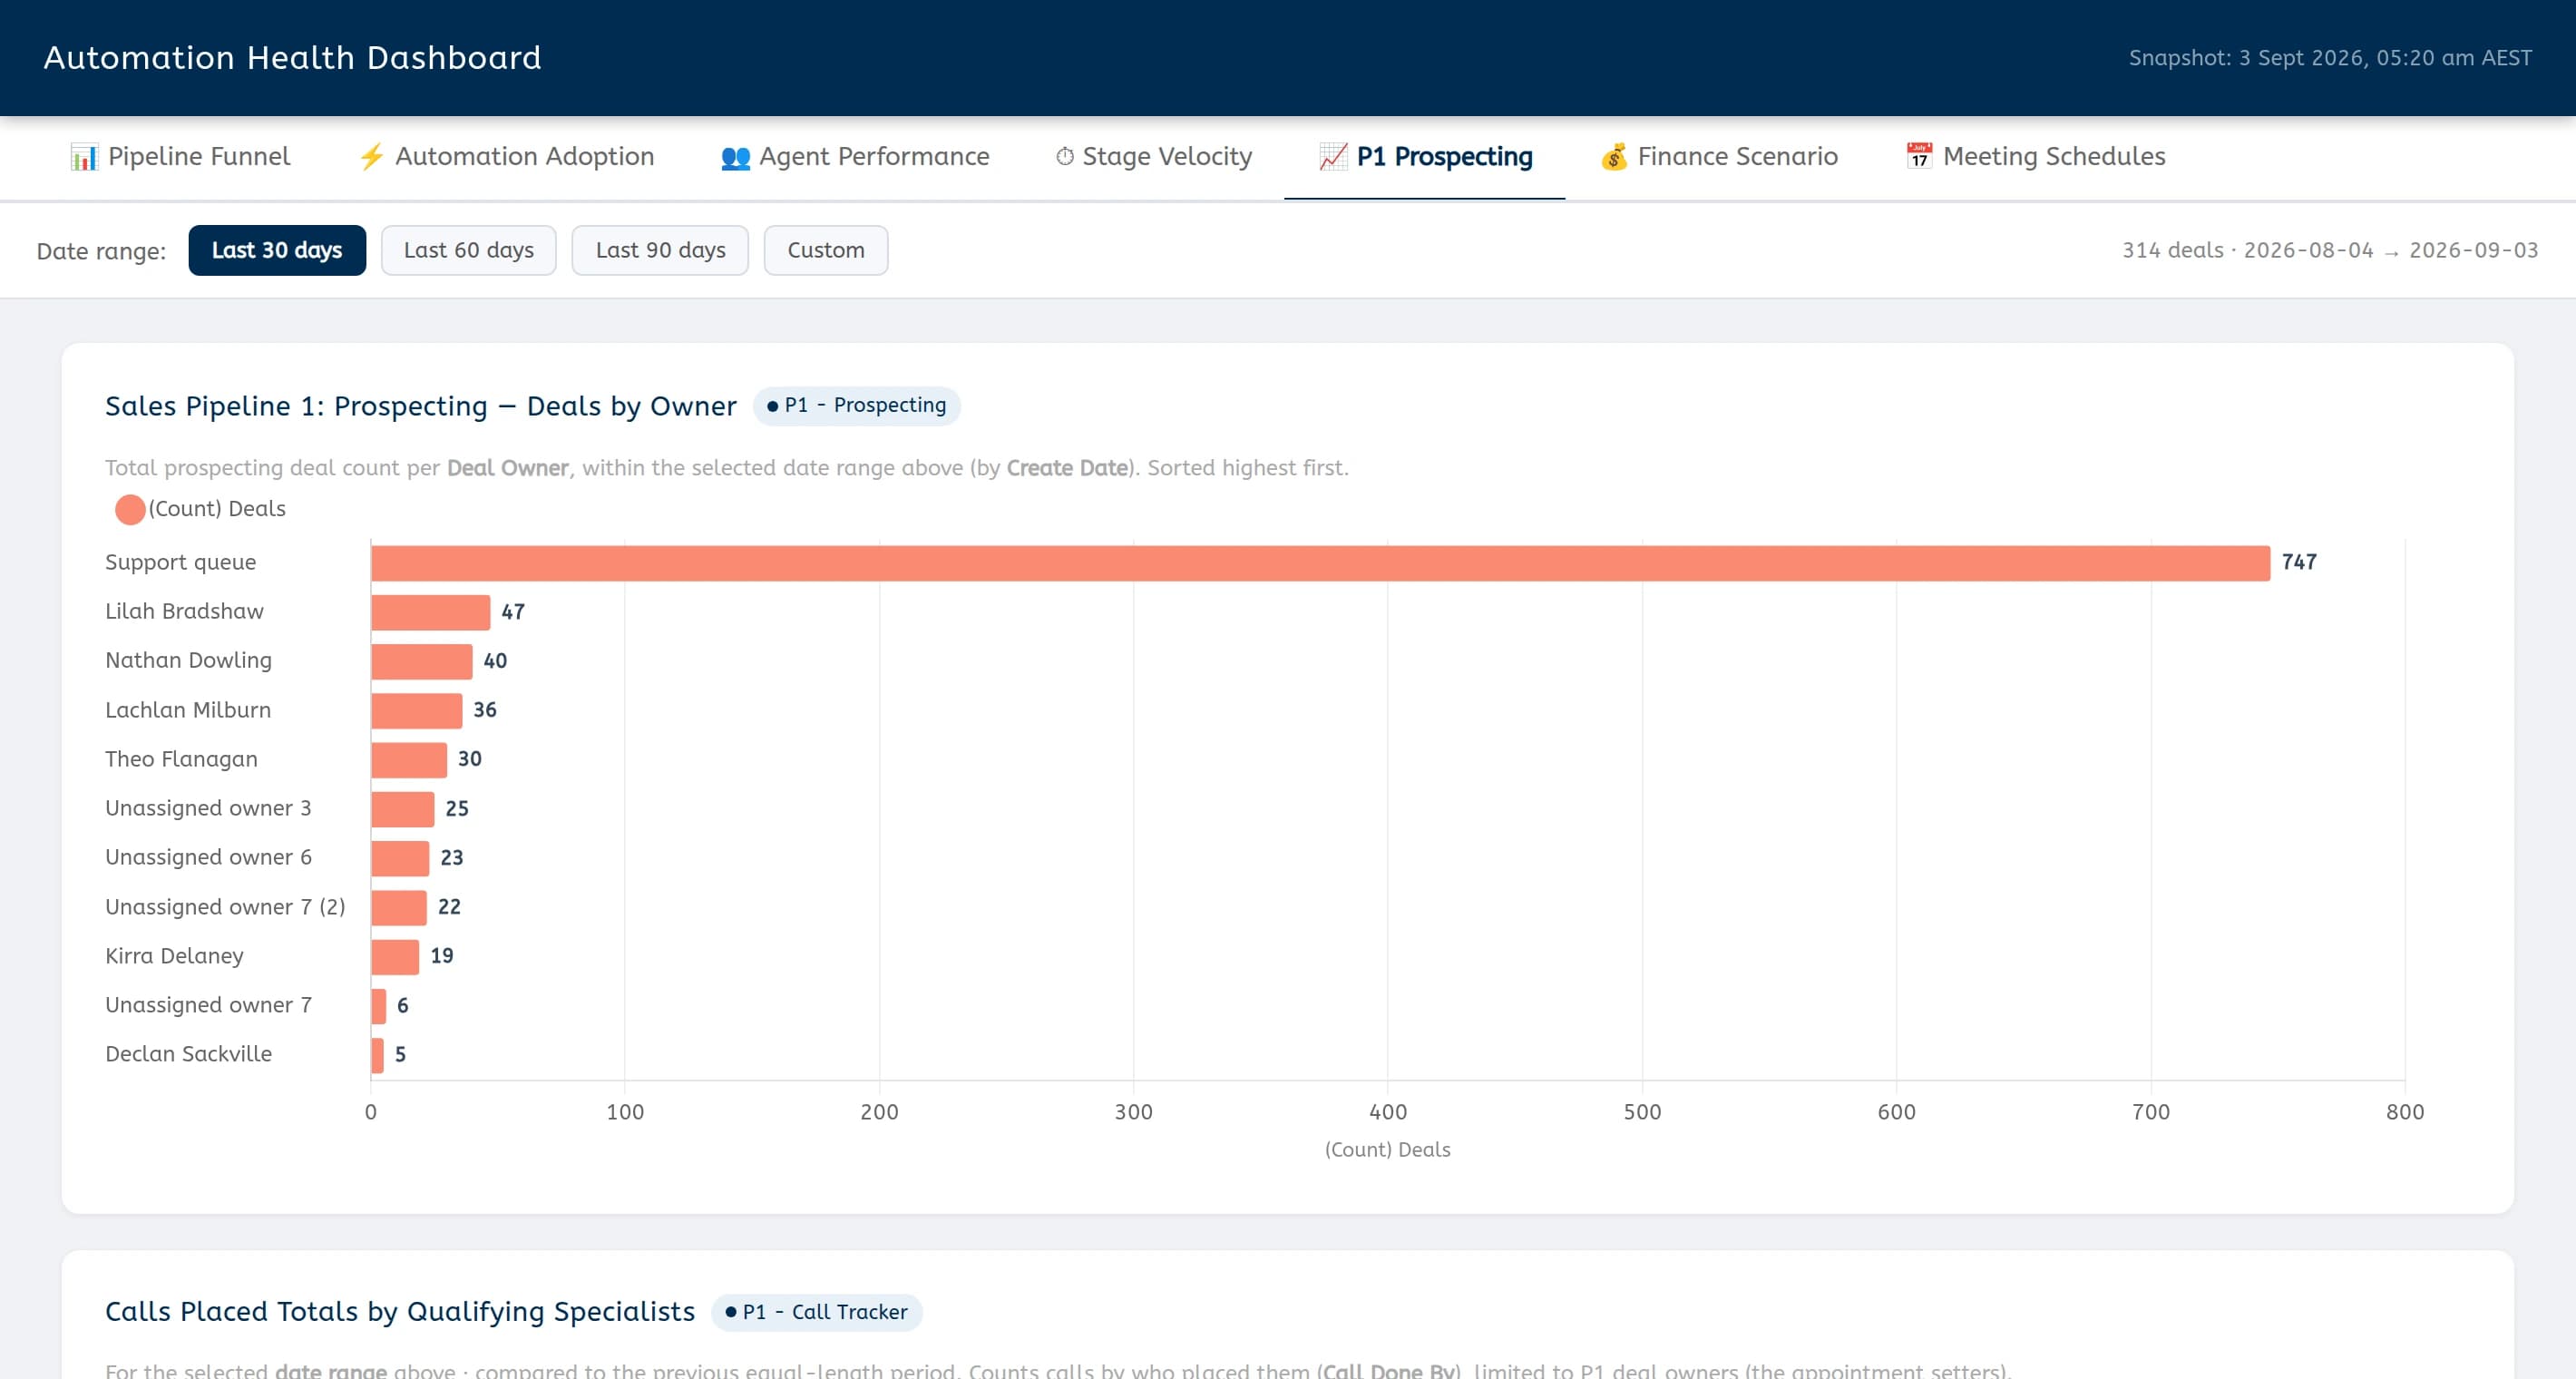
Ten people, one view
Individual performance, read together
Each agent's numbers used to be a separate export. They now land on one screen — same window, same definitions, same live data.
How it is wired
Built on the systems the team already uses
No migration, and no new system of record. The dashboard reads what the business already produces and turns it into one feed.
Where the work already happens
SourcesDeals, meeting outcomes, bookings and documents stay exactly where the team creates them.
HubSpot
From reporting to deciding
A number nobody looks at is not reporting.
The point was never the dashboard. It was the decision somebody makes because of it.
The decision it forced
Eighteen finance scenarios had gone quiet
Finance scenarios are the step between a strategy meeting and a deal. The dashboard tracks each request from raised to completed — and the first time the 90-day view was opened, it named the ones that had been sitting.
Finance Scenario · the live dashboard, 90-day window
66
scenarios in the 90-day window
The week ahead
What is booked, without asking anyone
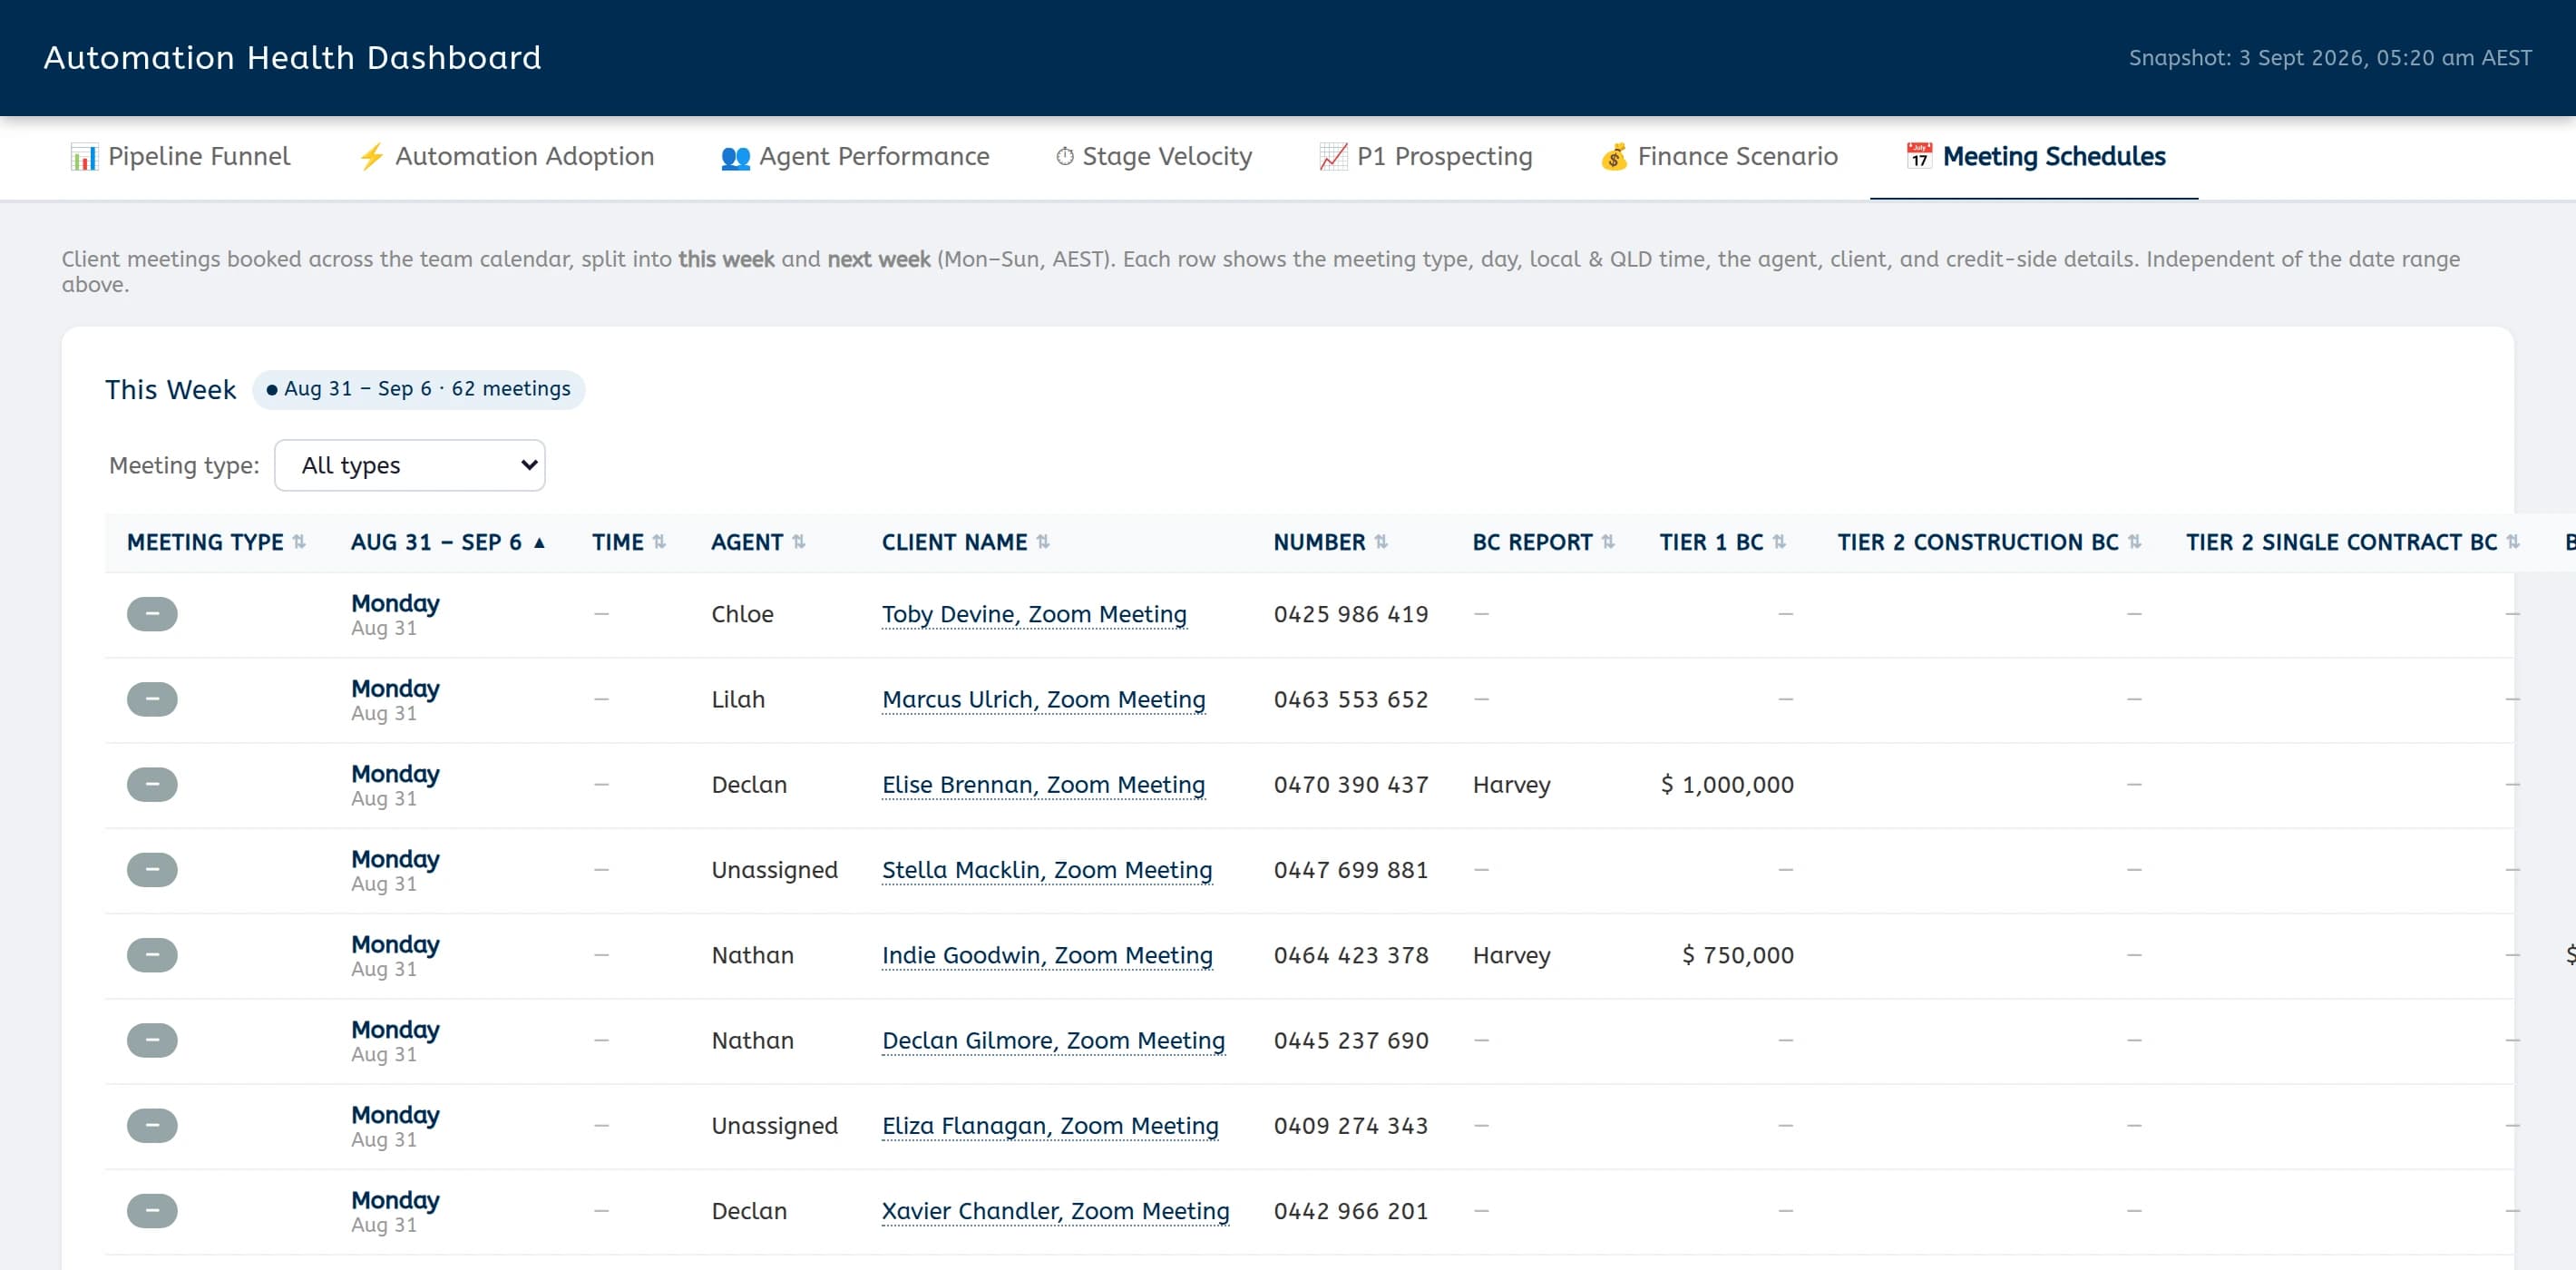
The meeting view is bucketed by week rather than by the page's date filter, because the question it answers is always "what is on".
Sixty-two client meetings in the current week, each with its type, day, the agent running it and the credit-side detail the finance team needs before the call.
Meeting Schedules · the live dashboard
What runs, what stays human, what we can add
The honest split. A dashboard is only trustworthy if it is clear about which parts of the system are automatic and which are somebody's judgement.
Runs itself
Running unattended
Live reads from the source systems every time the screen is opened
Form and folder creation checked on every deal, every stage
Stage movement and conversion recalculated on every load
Finance scenario ageing, including the over-seven-days list
Domain-locked sign-in on every page and data route
You decide
Deliberately still human
What changed
One screen instead of a rebuild The whole pipeline — first appointment through to EOI — reads from one application, so asking a different question no longer means assembling a different spreadsheet.
Silent failures stopped being silent A deal missing its form or folder shows up on the day, against a fire rate the team can see, rather than surfacing weeks later.
Reporting runs unattended The screen reads the source systems in real time, so the numbers are current whenever someone opens it; nobody prepares the Monday numbers.
Stalled work has a name and an age Stale deals and ageing finance scenarios are listed with how long they have been sitting, which is what turns a dashboard into a decision.
Want a system like this?
Built on your stack. Owned by you. Shipped in weeks.