The scorecard
Four groups. Twelve numbers.
How much are we spending, and what does it cost?
Spend and reach first. Cost and conversion next. Every tile carries a badge for how it moved.
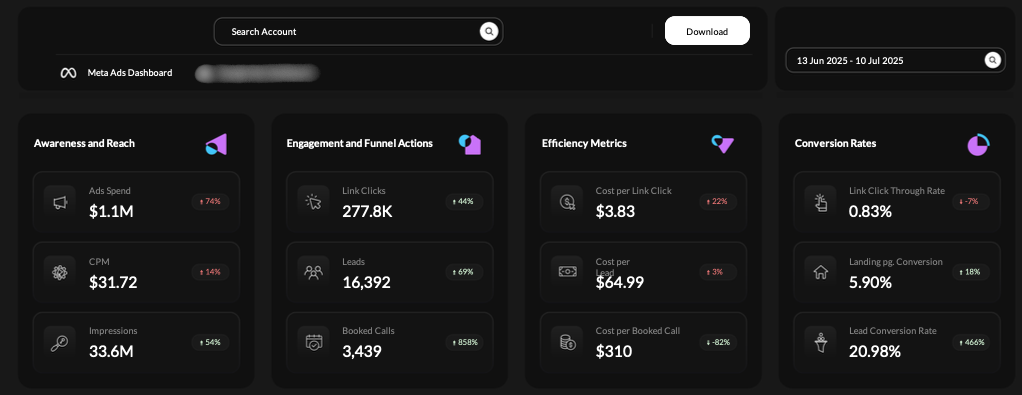
Tap a number to zoom in.
Meta Ads reporting
See the Meta Ads dashboard that turns spend, creative and funnel data into one operating view. Enter your email and we will send you the full blueprint.
Get the dashboard blueprint
Free. Sent straight to your inbox. No spam, unsubscribe anytime.
Why platform numbers stop short
The platform's own columns are a fine start.
So we built the next layer. Spend, creative and funnel data on one screen, so your team reads cost, conversion and creative together.
What happened
Your ad account
What it bought
Your Meta Ads dashboard
What it answers
The questions a Meta report has to answer, and where each one lives on the dashboard.
Ads Spend, CPM and Impressions sit together in the first group.
See it on the dashboardLanding page conversion is leads divided by link clicks. The Leads tile and the funnel show the same thing from two sides.
See it on the dashboardCost per Lead and Cost per Booked Call sit side by side in the Efficiency group.
See it on the dashboardThe funnel shows the drop between every stage, from click to appointment.
See it on the dashboardTwo rings split leads by device and by placement.
See it on the dashboardThe creative table puts link clicks, spend and CTR side by side for every ad.
See it on the dashboardInside the dashboard
This is the Meta Ads dashboard we built. Scroll through it. Tap any number to zoom into that part of the screen. Every figure is for the period the screen shows.
The scorecard
How much are we spending, and what does it cost?
Spend and reach first. Cost and conversion next. Every tile carries a badge for how it moved.
Tap a number to zoom in.
The funnel
Are clicks turning into leads, and where do they drop out?
Five stages from click to appointment, with the drop from one to the next.
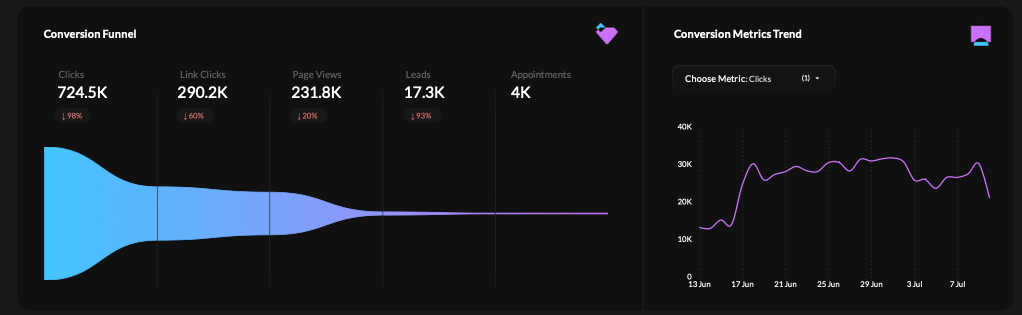
Tap a number to zoom in.
Device and placement
Which devices and placements drive leads?
Two rings for where leads come from. A line for when. Counts for how much is running.
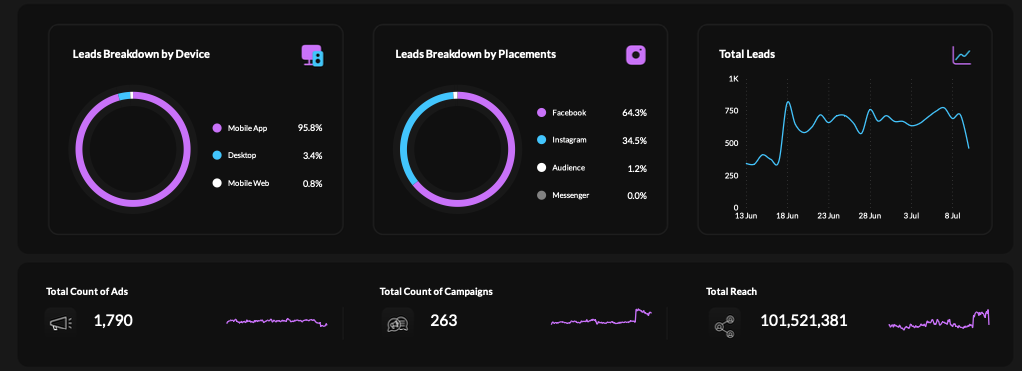
Tap a number to zoom in.
Creative performance
Which ads deserve attention?
Every ad on a row, with impressions, link clicks, spend and click through rate next to it.
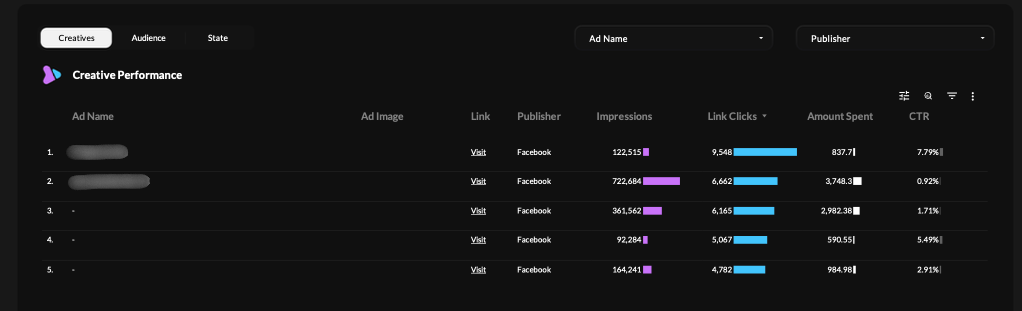
Tap a number to zoom in.
Scorecard view · Four groups, twelve numbers
What's inside
The dashboard, mapped, every section numbered on the dashboard itself.
Twelve KPIs, each with what it tells you, its formula and a check you can run yourself.
The funnel, five stages, the drop between them and how to read it.
Device and placement, how to read the splits, and what to check first.
The creative table, which columns to read together.
The data underneath, the API, the daily pipeline, the tables and the funnel view.
What to look at first, a short routine for your weekly review.
What you can download
The Meta Ads Performance Dashboard Blueprint
PDFThe dashboard section by section, twelve KPIs with formulas, the funnel logic, the data underneath and a first-look routine.
Who it's for
Founders who spend on Meta Ads and want one place to read the result.
Marketers who build reports for a team or a client.
Teams that track leads and booked calls, not only clicks.
Anyone planning a BigQuery reporting layer for Meta data.
Not for you if you want a template to copy. This is a breakdown, not a template.
Under the dashboard
Meta Ads API
Spend, reach, impressions, clicks, link clicks, landing page views and leads, by day and by ad.
A daily pipeline
A scheduled job pulls the API once a day and refreshes a rolling window of recent days.
BigQuery tables
Ads and campaigns as dimension tables (dim_ads, dim_campaigns). Performance as fact tables, split by device and publisher, by age and gender, and by country and region (fact_insights_by_device_publisher, fact_insights_by_age_gender, fact_insights_by_country_region).
A funnel view
Impressions, clicks, link clicks, landing page views and leads stacked into one stage and value table (device_publisher_funnel_mv), so a funnel is one query.
The dashboard
Tiles, funnel, trend, device, placement and creative views, each reading a table of this shape.
One dataset per client. Every table name carries the client's own prefix.
The blueprint covers all twelve KPIs, the funnel and the data underneath.
Questions, answered
Yes. You give us your email and we send the PDF. You can unsubscribe at any time.
No. It is a breakdown of the dashboard we built. Every section, the definitions, the formulas and the data underneath, so you can build your own.
A Meta Ads account and somewhere to land the data each day. We use BigQuery. The blueprint shows the tables and the funnel view.
Yes. That is what we do. We build the pipeline first and the dashboard on top of it.
Get the full blueprint. It lands in your inbox in a few minutes.
Free. Sent straight to your inbox. No spam, unsubscribe anytime.
Keep exploring the Intelligence Library
Marketing
2026-09-27
Reporting & Dashboards

2026-08-28
Marketing
2026-06-12