Intelligence Library

Paid media + creative intelligence

See which creatives are actually moving the numbers.

We built a dashboard that puts every creative next to its purchases, spend and return. Enter your email and we will send you the full breakdown.

Get the dashboard breakdown

Form not loading? Open it in a new tab

Free. Sent straight to your inbox. No spam, unsubscribe anytime.

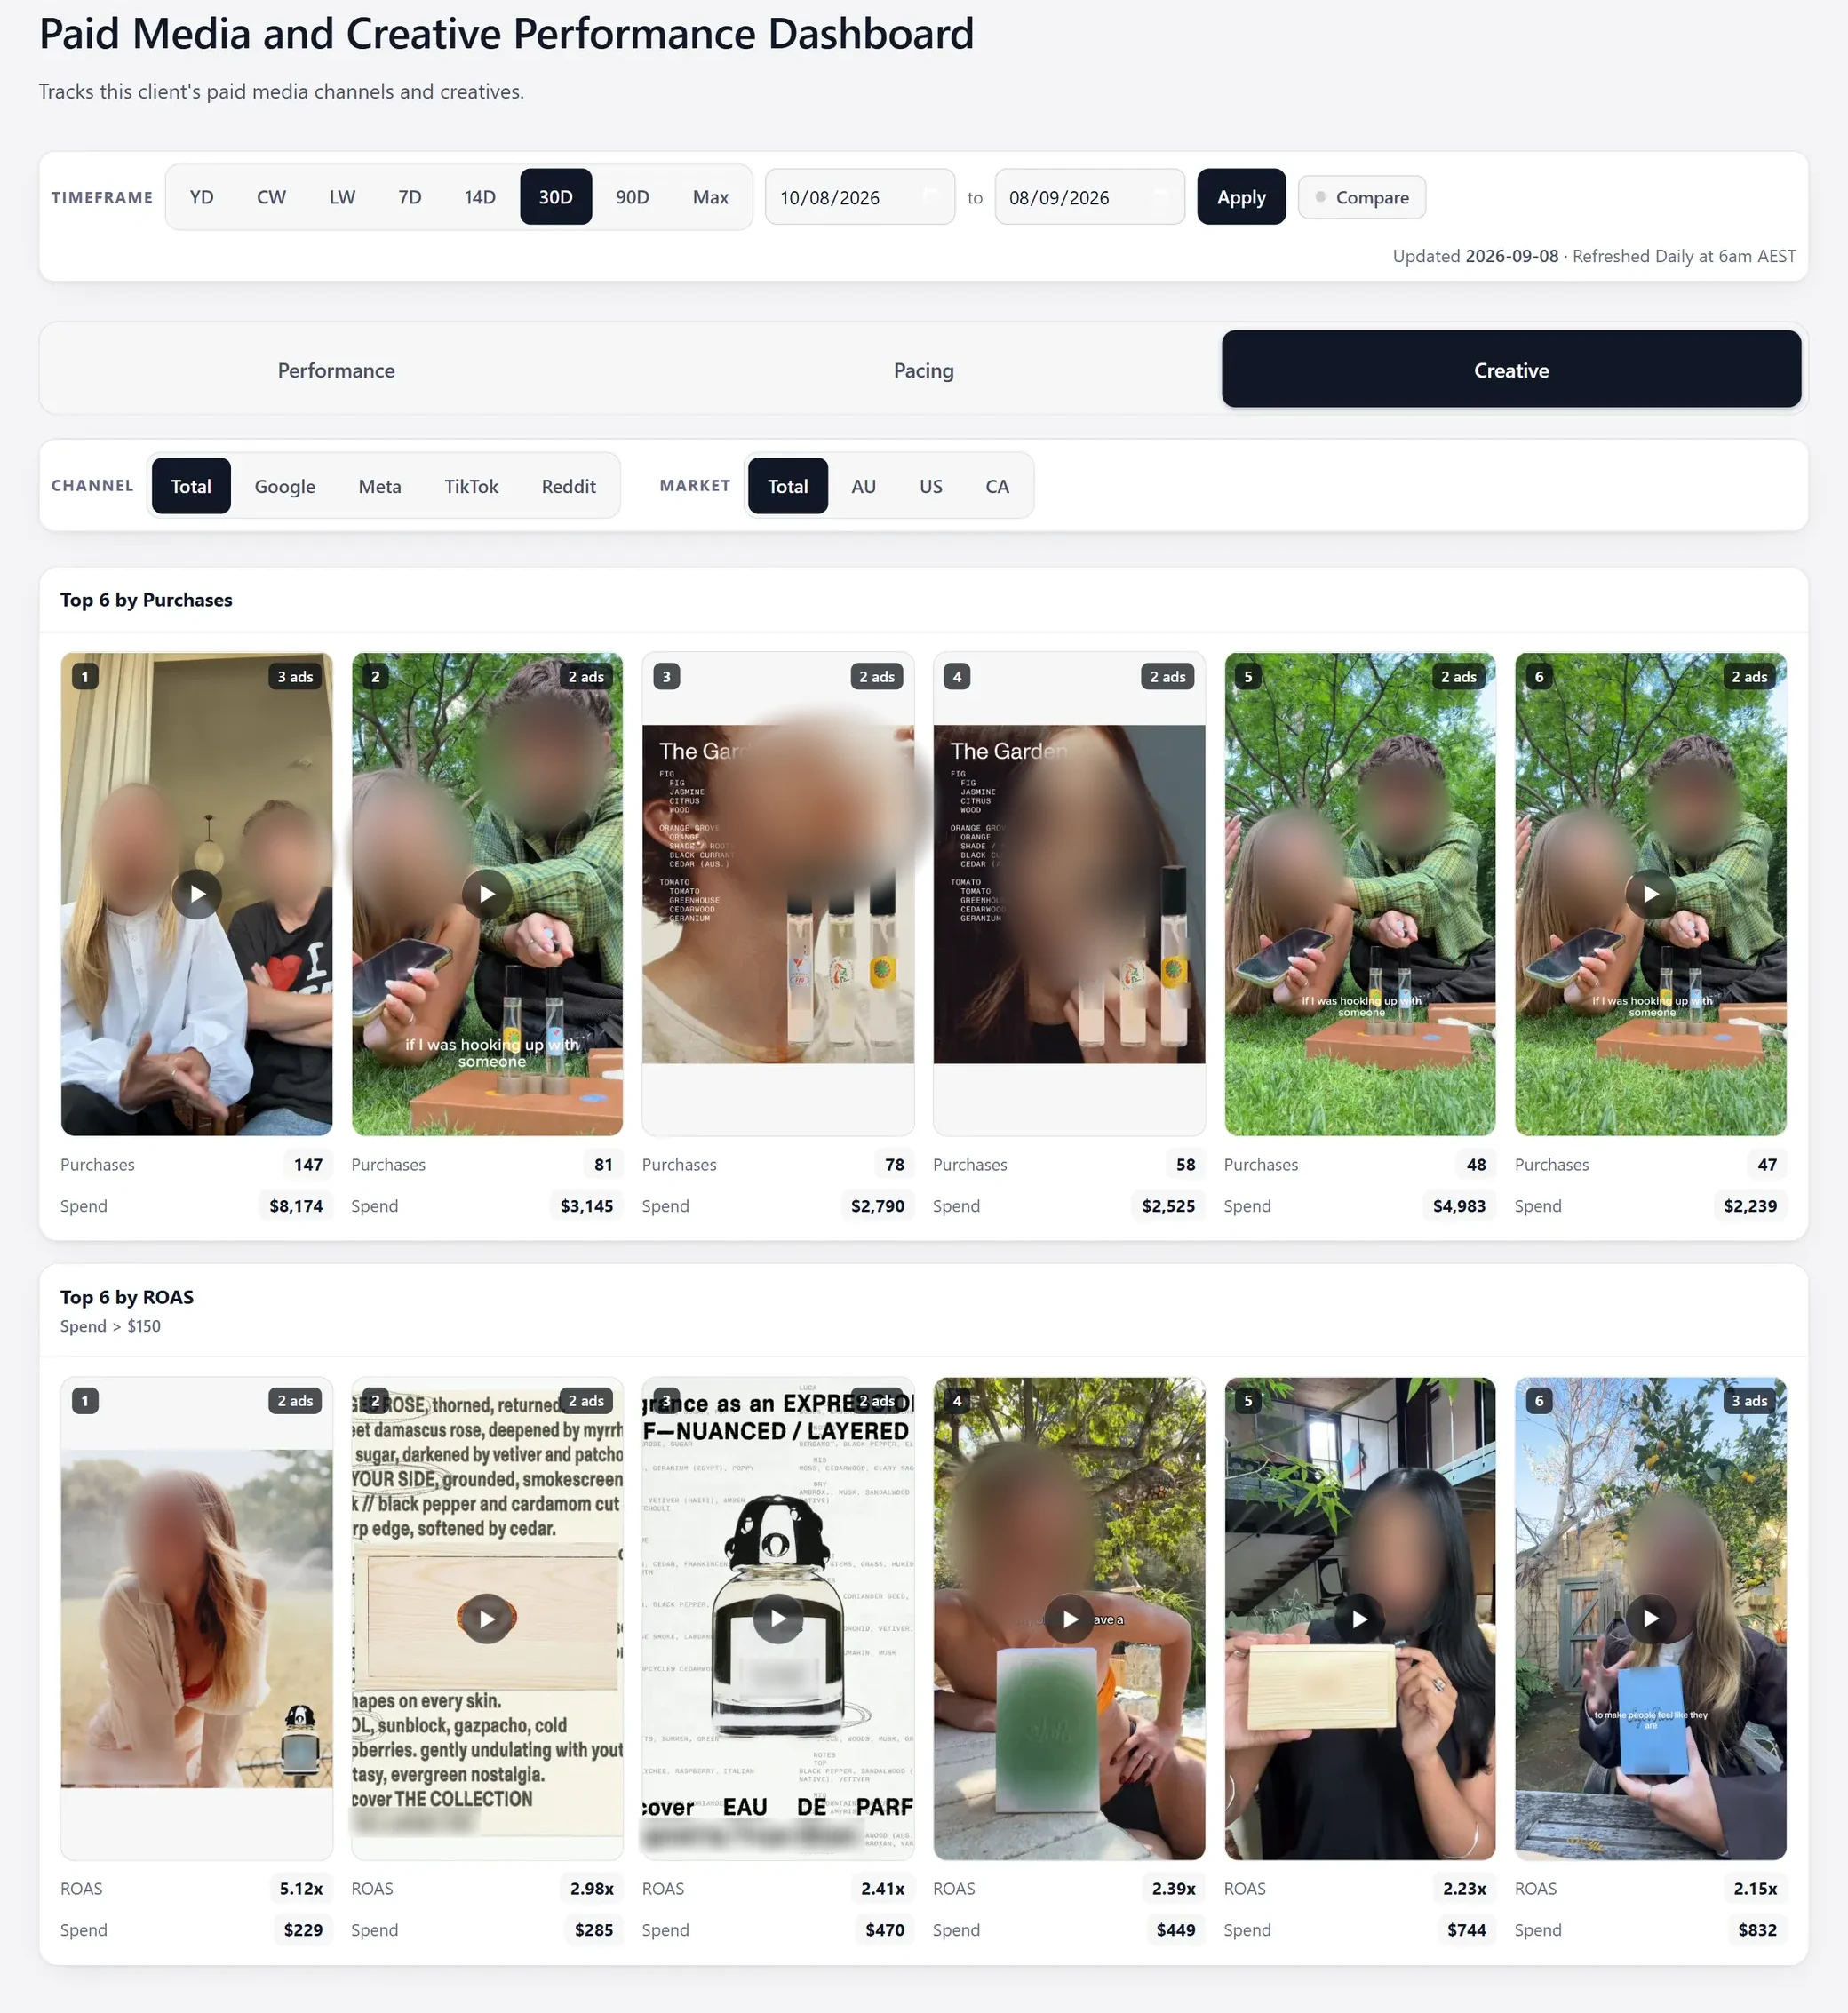
Creative view · Top 6 by Purchases

Why normal ad reporting stops too early

Your ad account tells you what happened.Your creative dashboard tells you why.

Every platform reports its own numbers, one campaign at a time. That is where most reporting stops.

Your team is left guessing which idea actually worked. So we built the next layer. The creative itself, sitting next to what it bought.

What happened

Your ad account

  • Spend, clicks and purchases, one platform at a time.
  • Rows of numbers for campaigns, ad sets and ads.
  • No single view of which creative idea is winning across them.

Why

Your creative dashboard

  • The creative itself, next to what it bought.
  • Every channel you buy on, in one place.
  • The same creative across several ads, read as one.
  • Google Ads
  • Meta Ads
  • TikTok Ads
  • Reddit

Inside the dashboard

One screen for every channel and every creative.

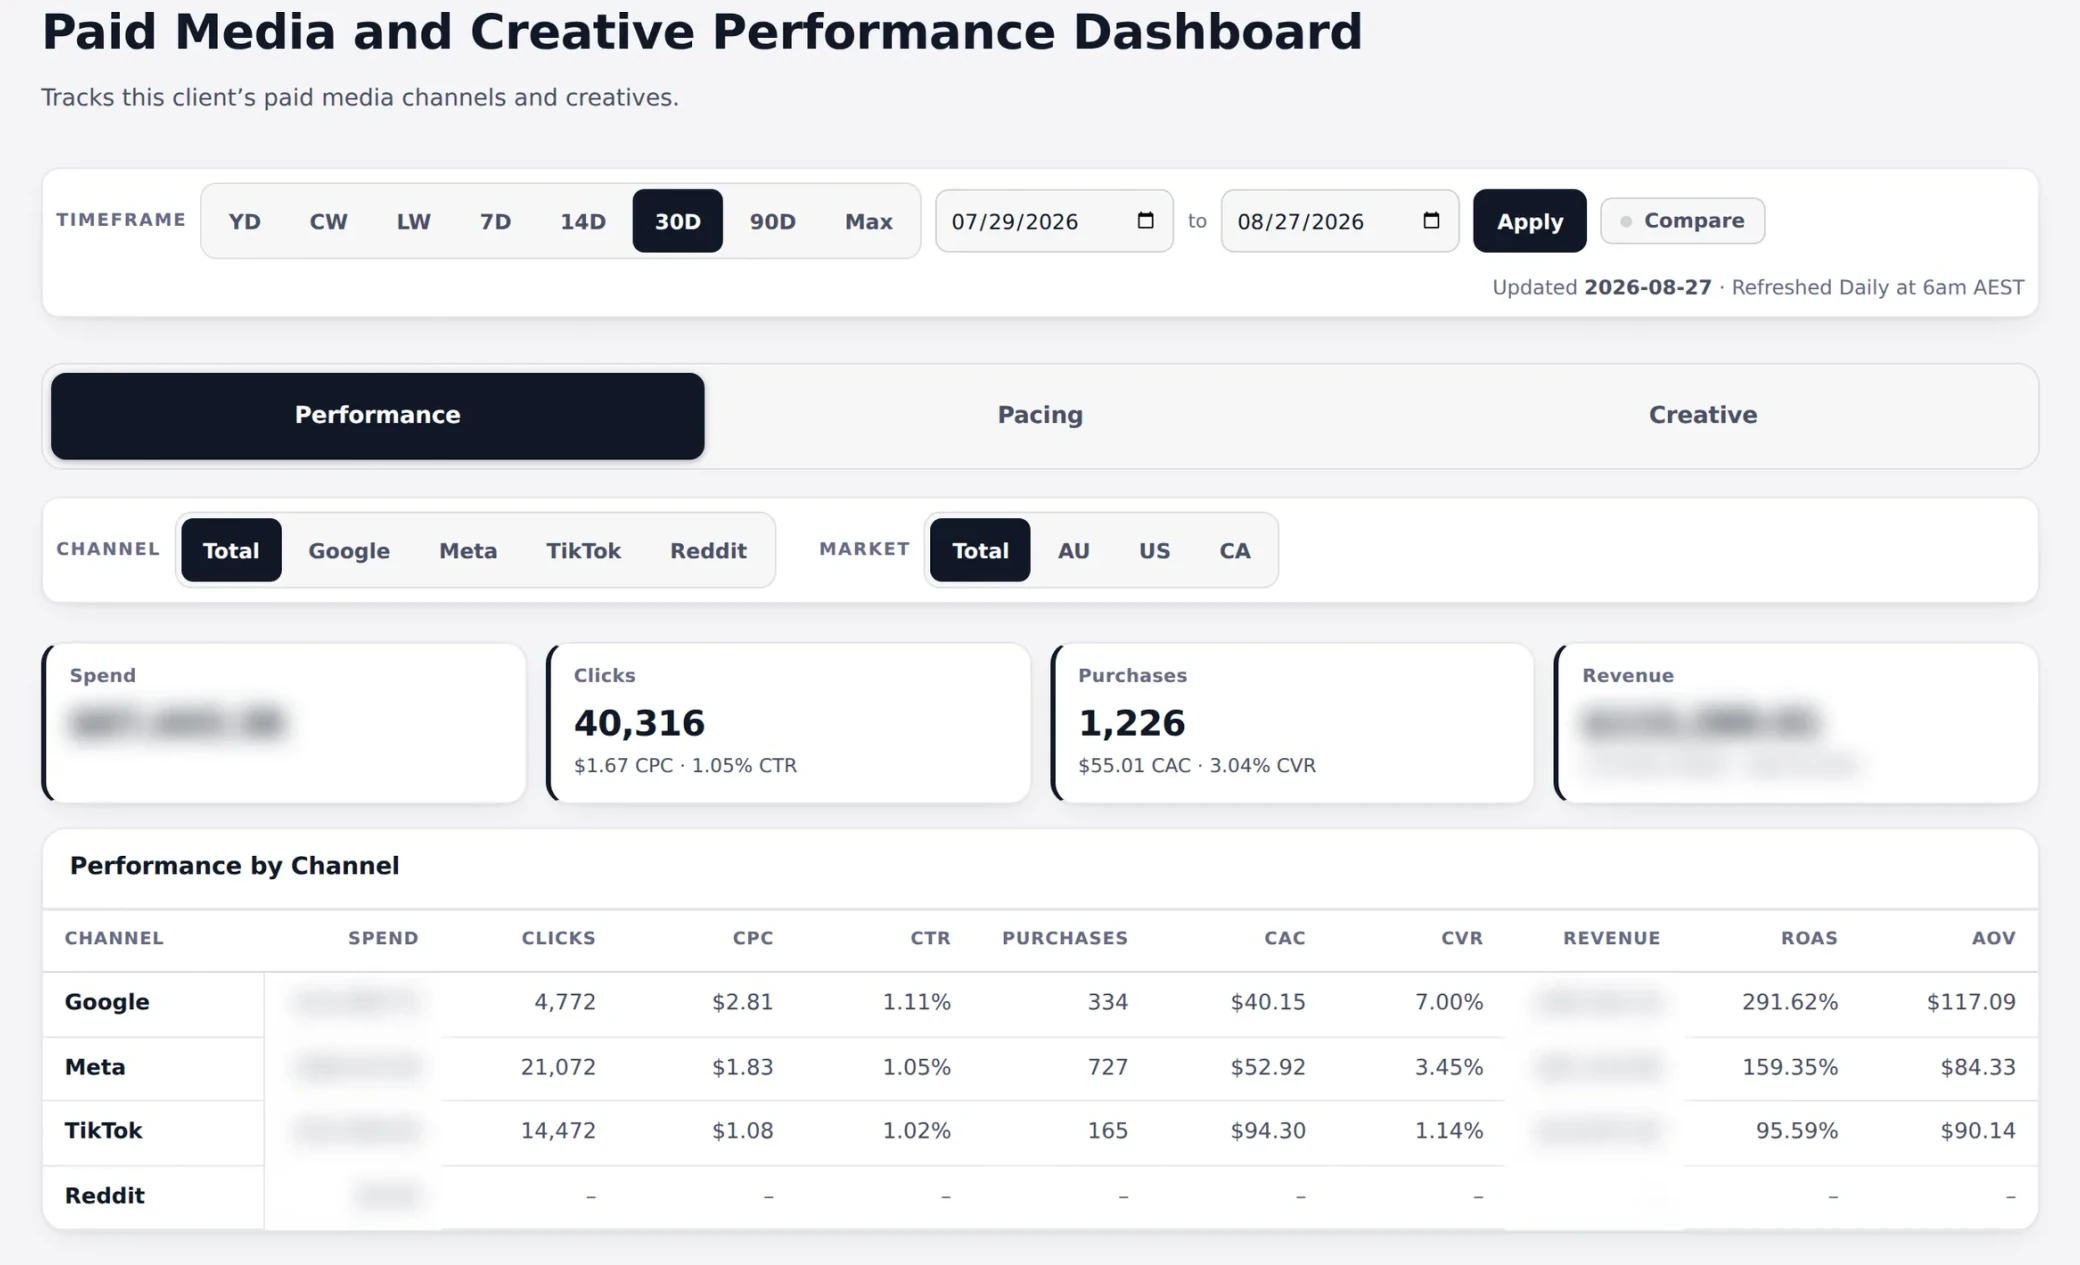
This is the dashboard we built for a performance marketing agency, for one of their clients. Scroll through it. Tap any number to zoom into that part of the screen.

The overview

The same controls, on every view.

Where do you start?

Timeframe, channel and market sit at the top. The views sit underneath them.
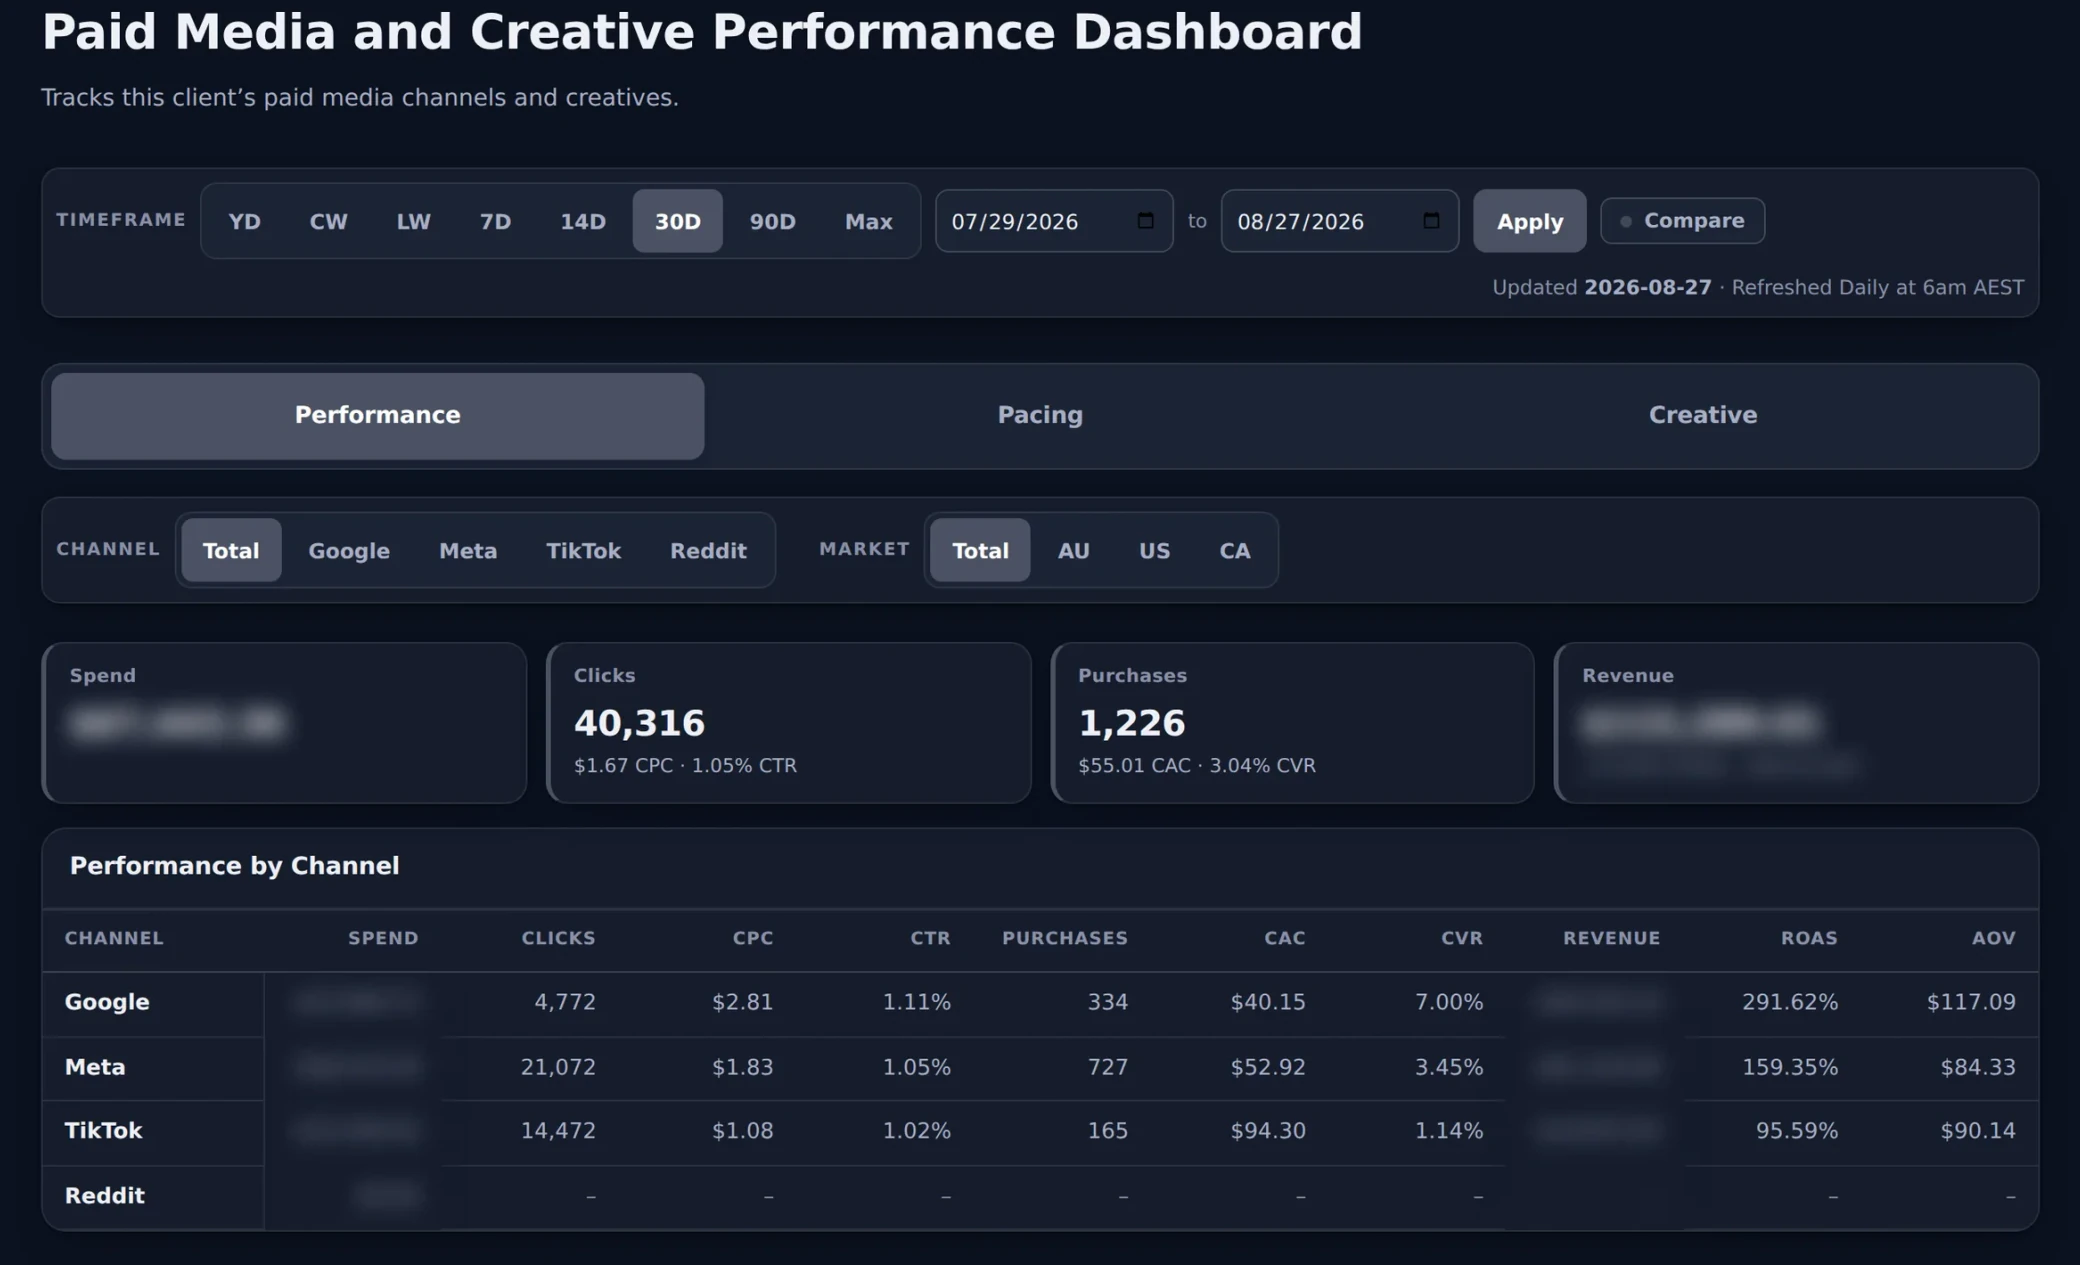
The Performance view of the Paid Media and Creative Performance Dashboard. Timeframe presets and a custom date range sit above the Performance, Pacing and Creative tabs, then channel and market filters. Four tiles cover spend, 40,316 clicks at $1.67 CPC and 1.05% CTR, 1,226 purchases at $55.01 CAC and 3.04% CVR, and revenue. Performance by Channel lists Google, Meta, TikTok and Reddit with clicks, CPC, CTR, purchases, CAC, CVR, ROAS and AOV, and the Reddit row shows dashes.

Tap a number to zoom in.

Performance

Where the money goes, and what it buys.

Where is spend going, and what is it buying?

Four numbers first. Then every channel, side by side.

The Performance view of the Paid Media and Creative Performance Dashboard. Timeframe presets and a custom date range sit above the Performance, Pacing and Creative tabs, then channel and market filters. Four tiles cover spend, 40,316 clicks at $1.67 CPC and 1.05% CTR, 1,226 purchases at $55.01 CAC and 3.04% CVR, and revenue. Performance by Channel lists Google, Meta, TikTok and Reddit with clicks, CPC, CTR, purchases, CAC, CVR, ROAS and AOV, and the Reddit row shows dashes.

Tap a number to zoom in.

Creative

The ads themselves, ranked.

Which creatives are driving purchases?

Same controls. Now every ad shows up as the creative your team made.
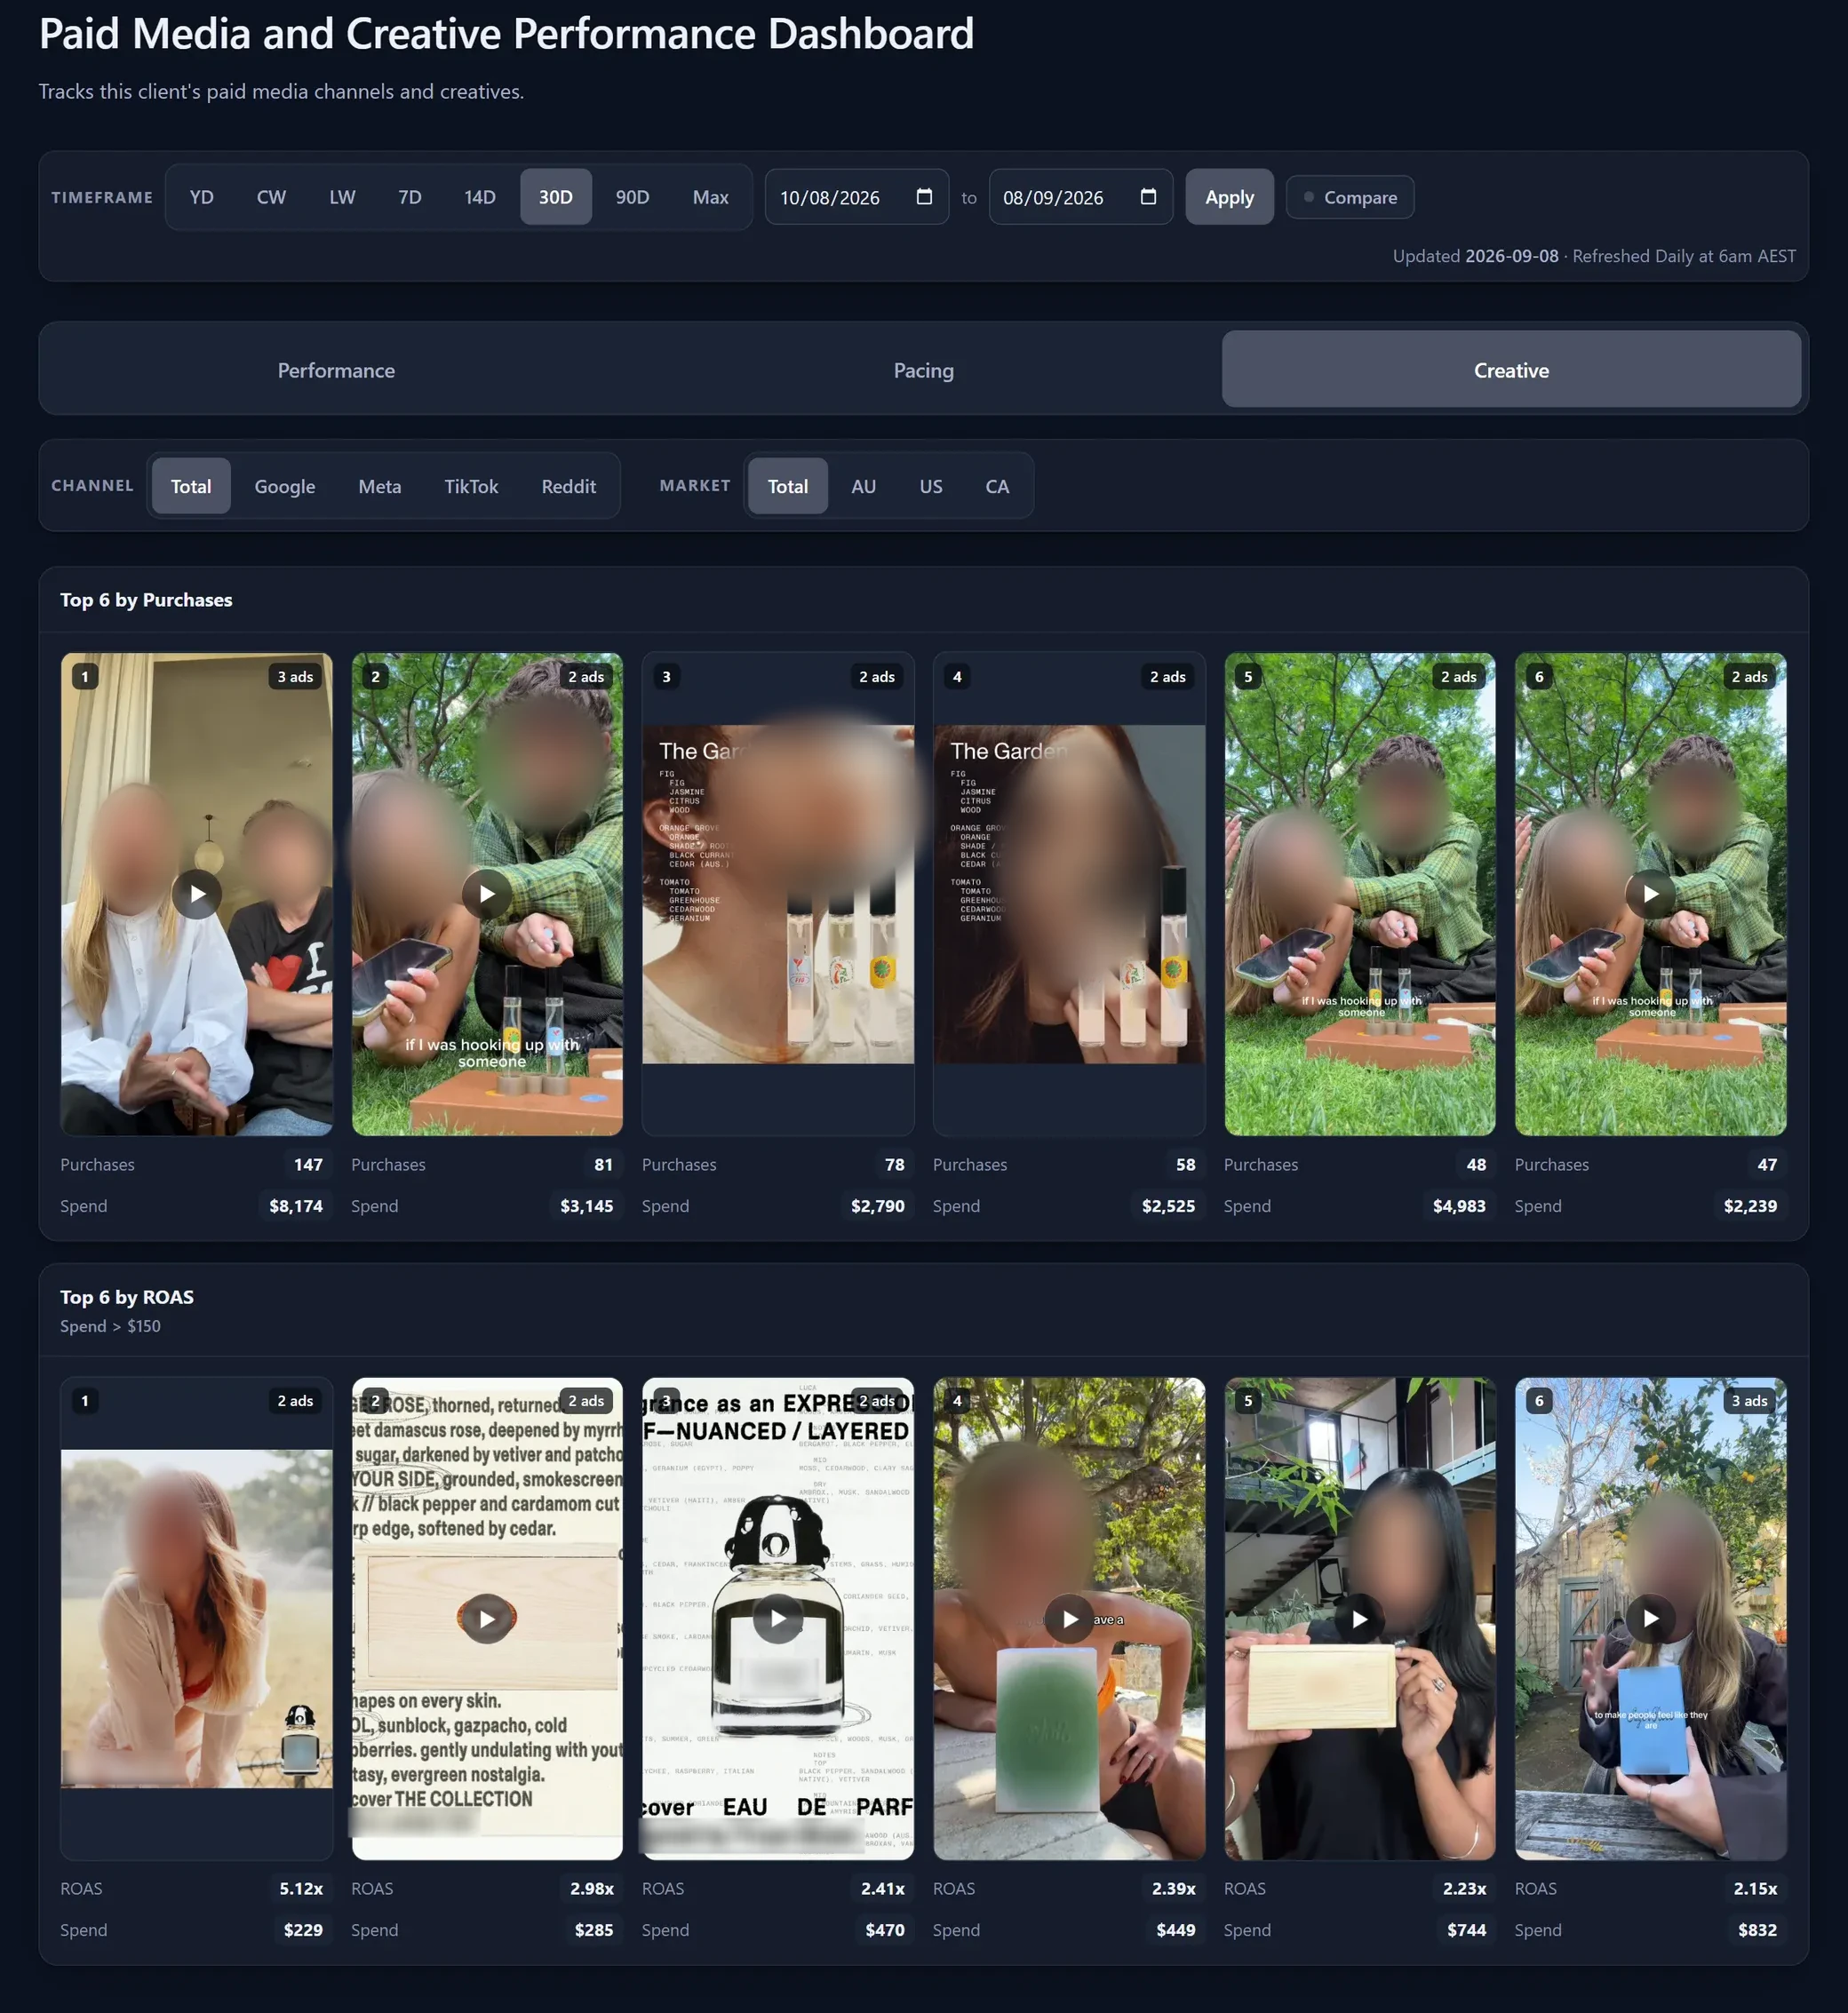
The Creative view of the Paid Media and Creative Performance Dashboard, with Creative selected in the tabs. Channel and market filters sit above two boards: Top 6 by Purchases, led by a creative with 147 purchases on $8,174 of spend, and Top 6 by ROAS for ads over $150 of spend, led by one returning 5.12x on $229. Every card shows the ad still, its rank and how many ads it covers.

Tap a number to zoom in.

Real creative examples

These are real ads from the Creative view, ranked by the dashboard. Look at who wins each board.

Most purchases

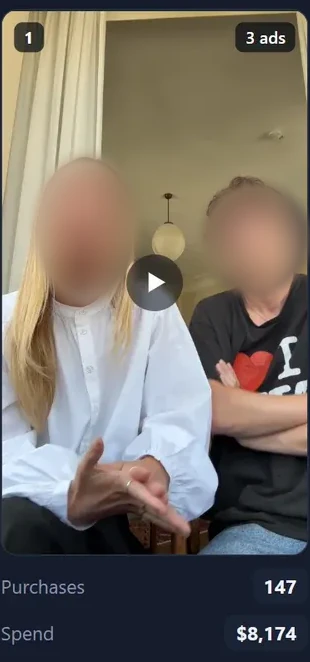
Top 6 by Purchases

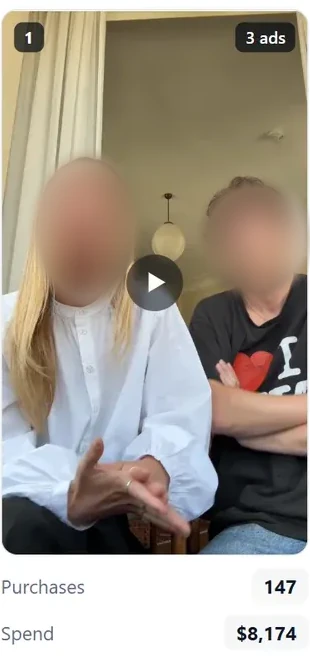
  • Rank 1 on the purchases board. A video still of two people sitting together, badged 3 ads, with 147 purchases on $8,174 of spend.
    No. 1147 purchases · $8,174 spend
  • Rank 2 on the purchases board. A video still of two people on a lawn with the product, badged 2 ads, with 81 purchases on $3,145 of spend.
    No. 281 purchases · $3,145 spend
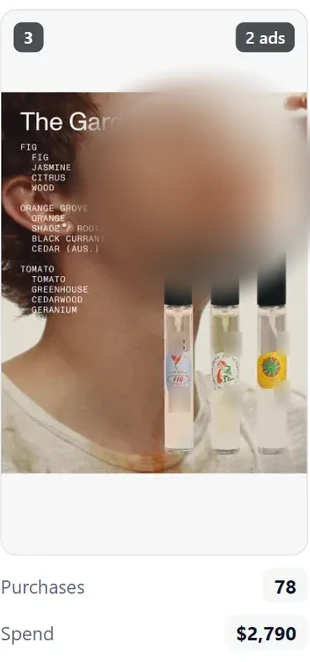
  • Rank 3 on the purchases board. A product image titled The Garden, with three vials in front of a person drinking, badged 2 ads, with 78 purchases on $2,790 of spend.
    No. 378 purchases · $2,790 spend

Best return

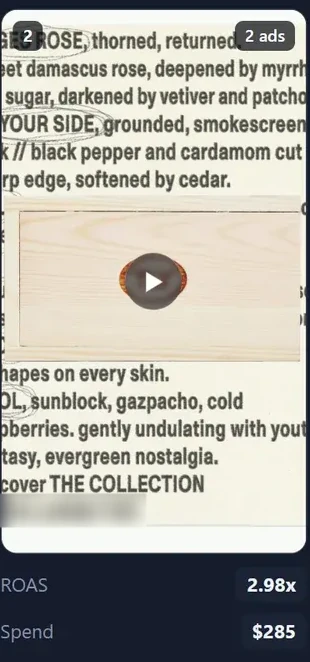
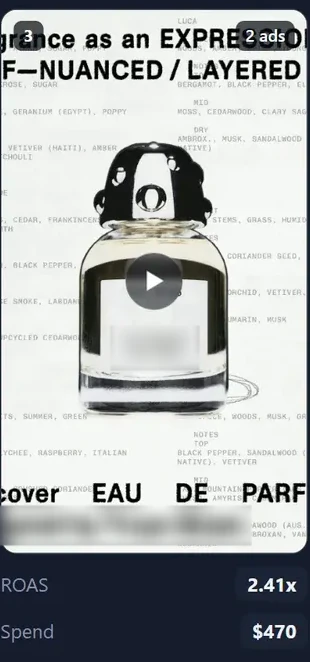
Top 6 by ROAS, spend over $150

  • Rank 1 on the ROAS board. An image ad of a person in a field beside the bottle, badged 2 ads, returning 5.12x on $229 of spend.
    No. 15.12x ROAS · $229 spend
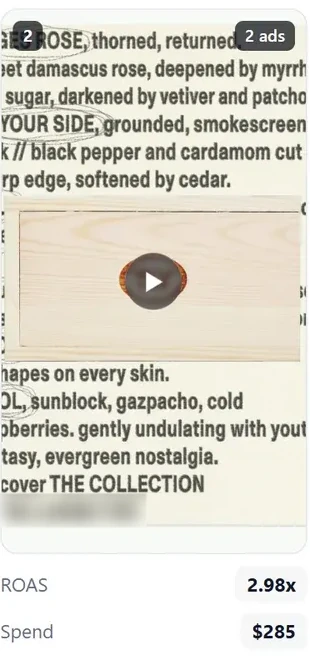
  • Rank 2 on the ROAS board. A video still set in type, describing a rose scent around a wooden box, badged 2 ads, returning 2.98x on $285 of spend.
    No. 22.98x ROAS · $285 spend
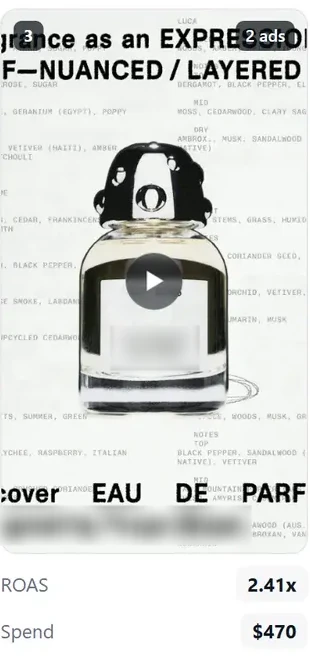
  • Rank 3 on the ROAS board. A video still set in type around a perfume bottle, badged 2 ads, returning 2.41x on $470 of spend.
    No. 32.41x ROAS · $470 spend

Not one of the six creatives with the most purchases makes the six with the best return. Volume and efficiency are different questions. Your team needs both answers.

What your team can decide

From numbers to next moves.

The dashboard does not make the call. It shortens the distance to it.

  1. 01

    Which creatives deserve more budget?

    Start with Top 6 by ROAS. The $150 spend floor keeps small lucky tests off it.

    See it on the dashboard
  2. 02

    Which creatives are carrying the volume?

    Top 6 by Purchases. It shows what each one spent to get there.

    See it on the dashboard
  3. 03

    Where is the spend going?

    Spend sits under every creative, and every channel gets its own row in Performance.

    See it on the dashboard
  4. 04

    Which channel is converting?

    Read CAC, CVR and ROAS down the channel rows.

    See it on the dashboard
  5. 05

    Which market is pulling ahead?

    Switch the market filter and read the same view again.

    See it on the dashboard
  6. 06

    What deserves attention next?

    A creative that is high on purchases but missing from the ROAS board. It is buying volume. Check what that volume costs.

    See it on the dashboard

Still your team's call

  • Deciding whether a number is a problem.
  • Choosing what to change in the account.
  • Briefing the next round of creative.

What's inside

Everything the dashboard breakdown covers

  • The full dashboard, annotated, every control and view explained on the dashboard's own screens.

  • How to read Performance, the four headline numbers and the channel table, column by column.

  • How to read Creative, the two boards, the $150 spend floor and creatives that run in several ads.

  • Real creative examples, what the boards showed, and the questions they raise.

  • The decisions it supports, six questions your team can answer from one screen.

  • What sits underneath, four ad platforms, one warehouse and a daily refresh.

  • A build checklist, what you need in place to build your own version.

What you can download

  • The Paid Media + Creative Performance Dashboard breakdown

    PDF

    The dashboard view by view, the metrics in plain words, real creative examples, the decisions it supports and a build checklist.

See the creative behind every number

Get the full breakdown of the dashboard, view by view. It lands in your inbox in a few minutes.

Form not loading? Open it in a new tab

Free. Sent straight to your inbox. No spam, unsubscribe anytime.