The overview
The same controls, on every view.
Where do you start?
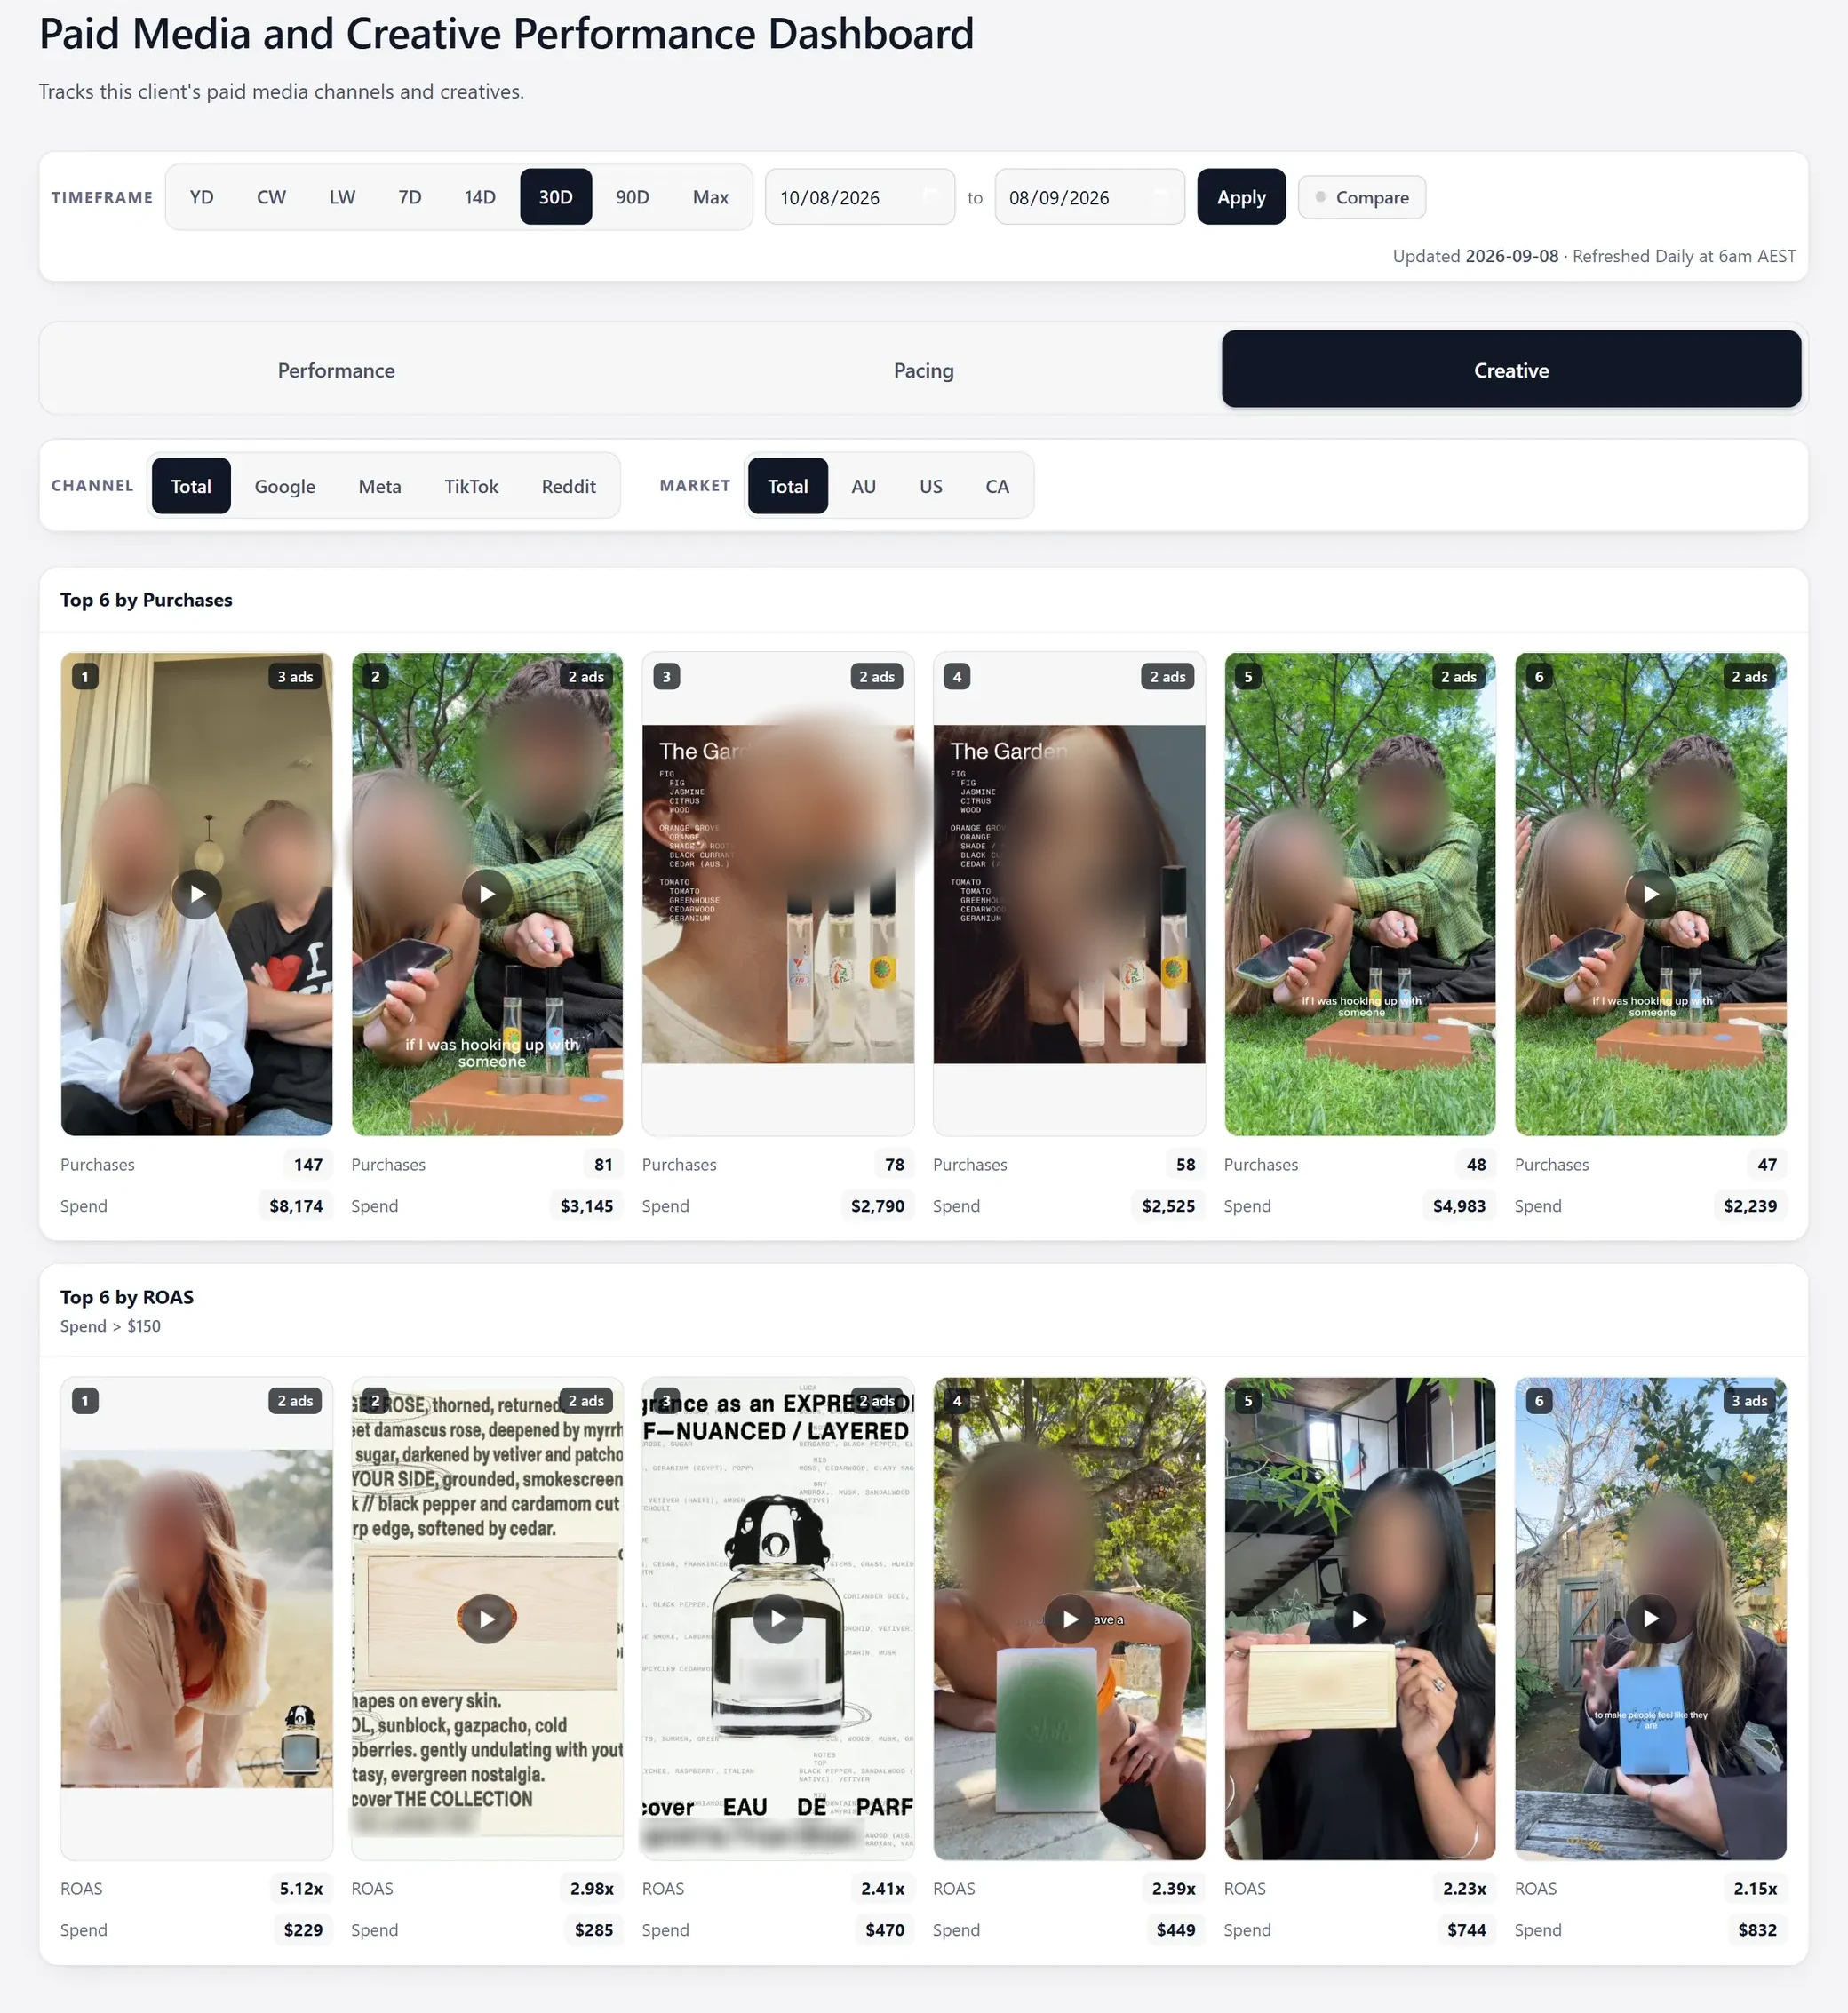
Timeframe, channel and market sit at the top. The views sit underneath them.
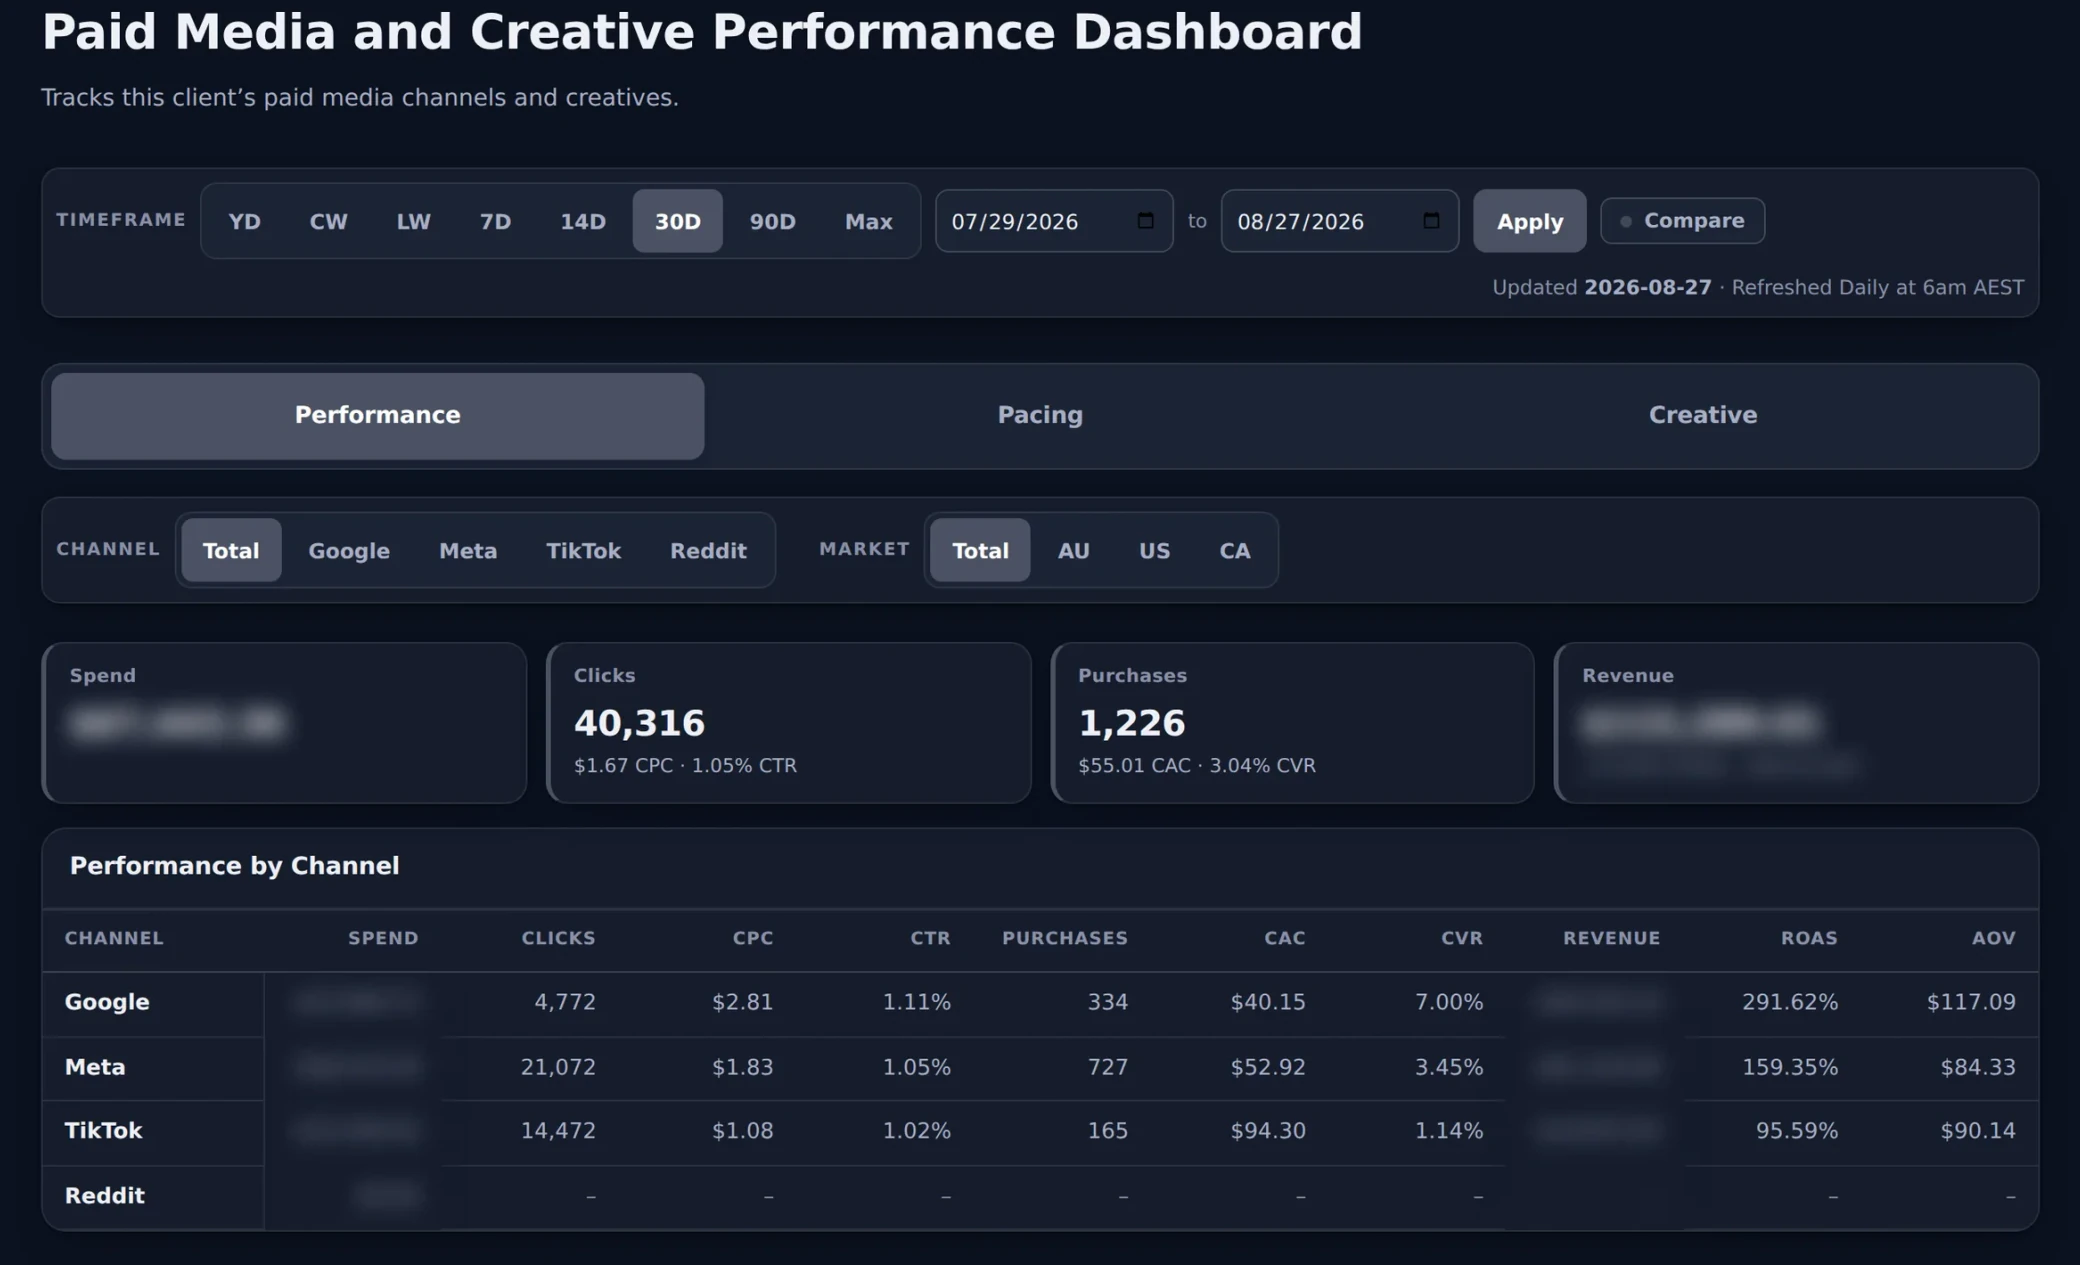
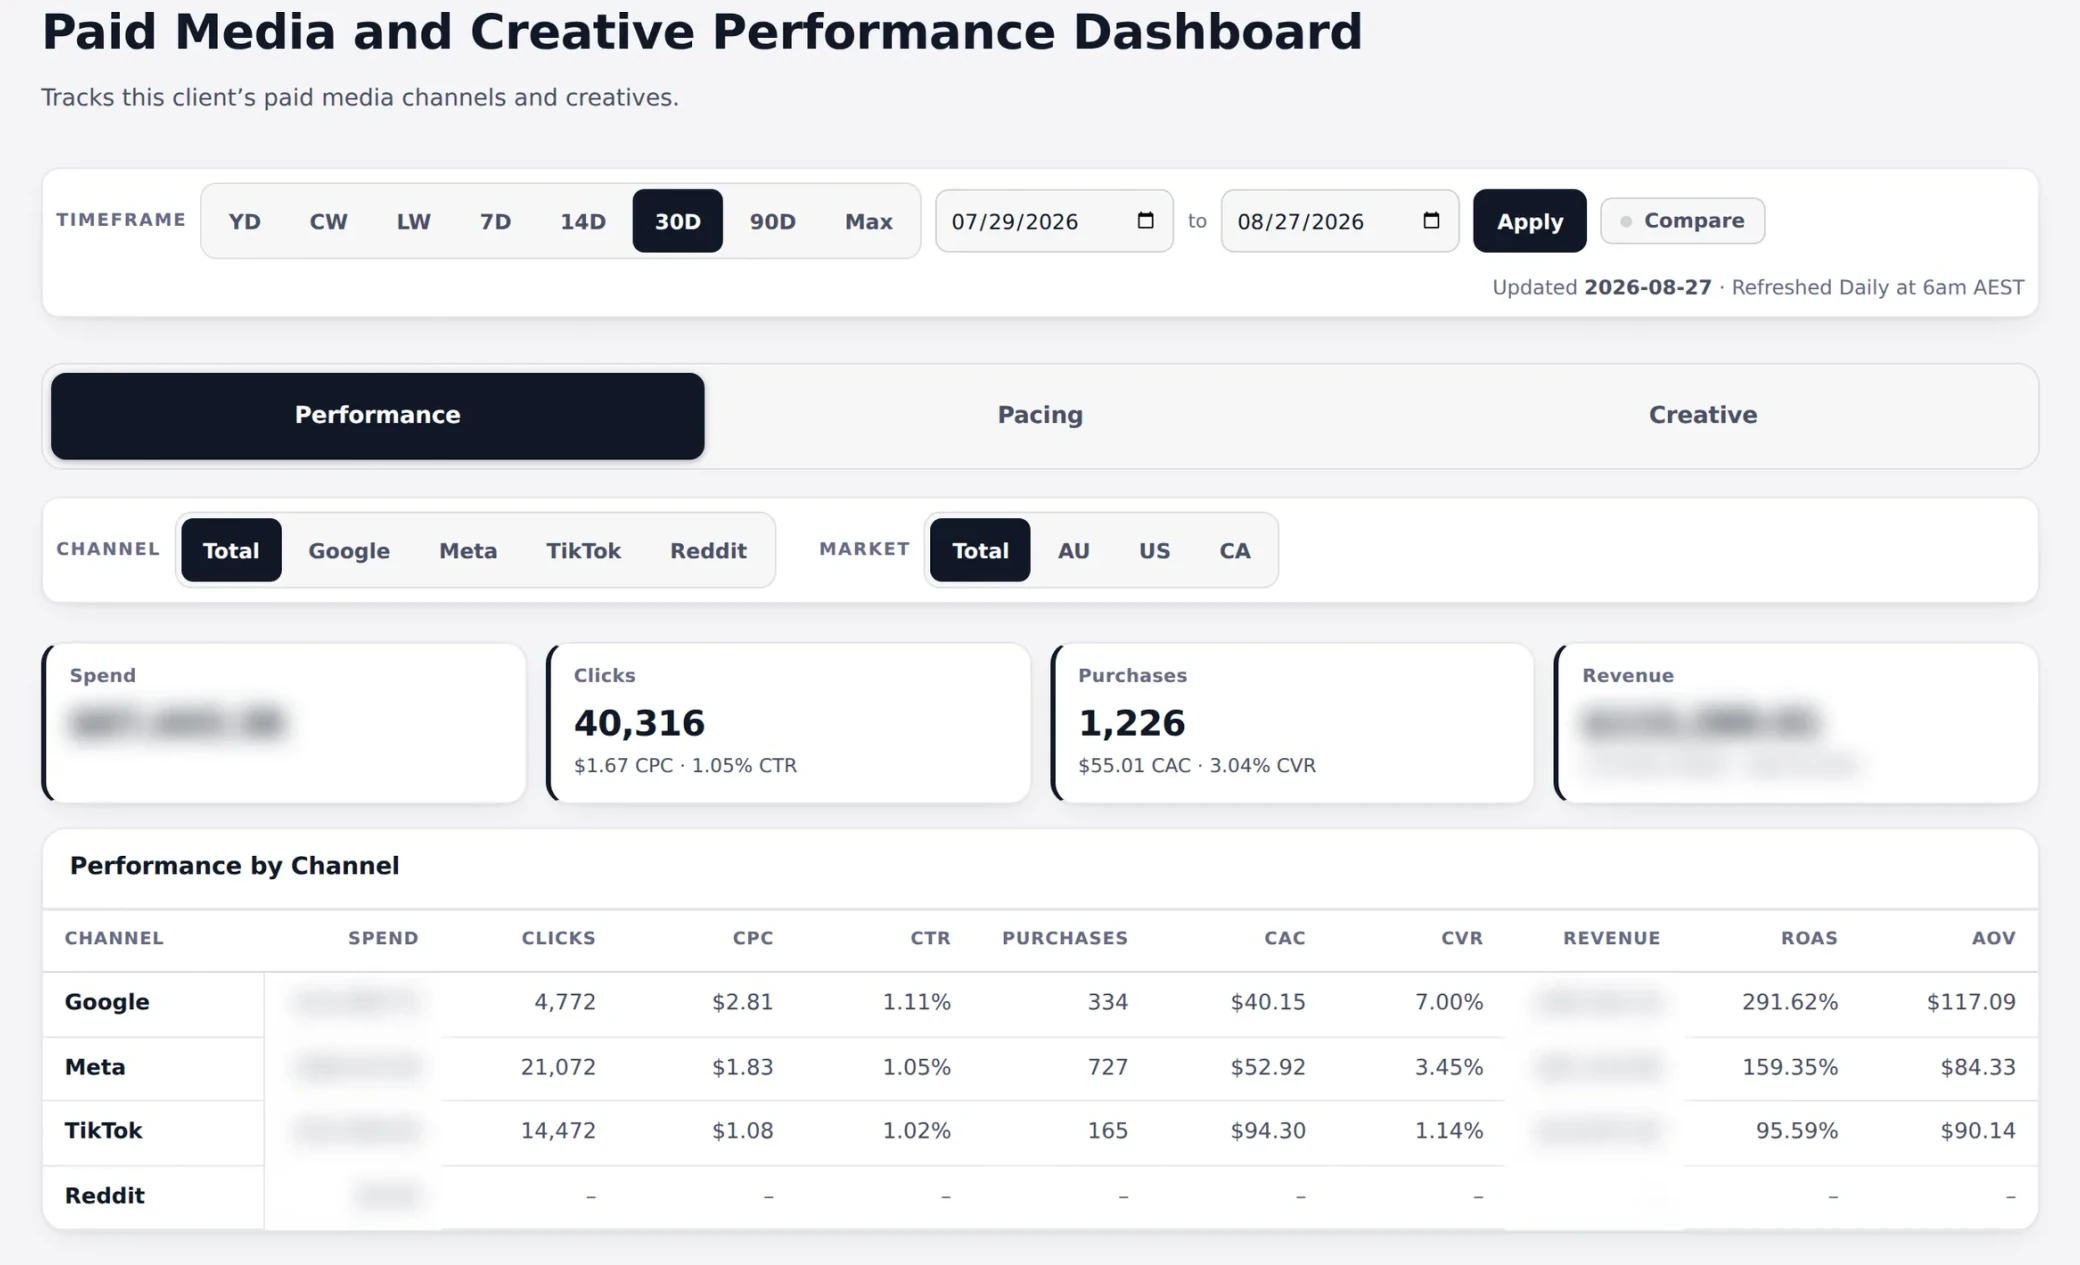
Tap a number to zoom in.
Paid media + creative intelligence
We built a dashboard that puts every creative next to its purchases, spend and return. Enter your email and we will send you the full breakdown.
Get the dashboard breakdown
Free. Sent straight to your inbox. No spam, unsubscribe anytime.
Why normal ad reporting stops too early
Every platform reports its own numbers, one campaign at a time. That is where most reporting stops.
Your team is left guessing which idea actually worked. So we built the next layer. The creative itself, sitting next to what it bought.
What happened
Your ad account
Why
Your creative dashboard
Inside the dashboard
This is the dashboard we built for a performance marketing agency, for one of their clients. Scroll through it. Tap any number to zoom into that part of the screen.
The overview
Where do you start?
Timeframe, channel and market sit at the top. The views sit underneath them.
Tap a number to zoom in.
Performance
Where is spend going, and what is it buying?
Four numbers first. Then every channel, side by side.
Tap a number to zoom in.
Creative
Which creatives are driving purchases?
Same controls. Now every ad shows up as the creative your team made.
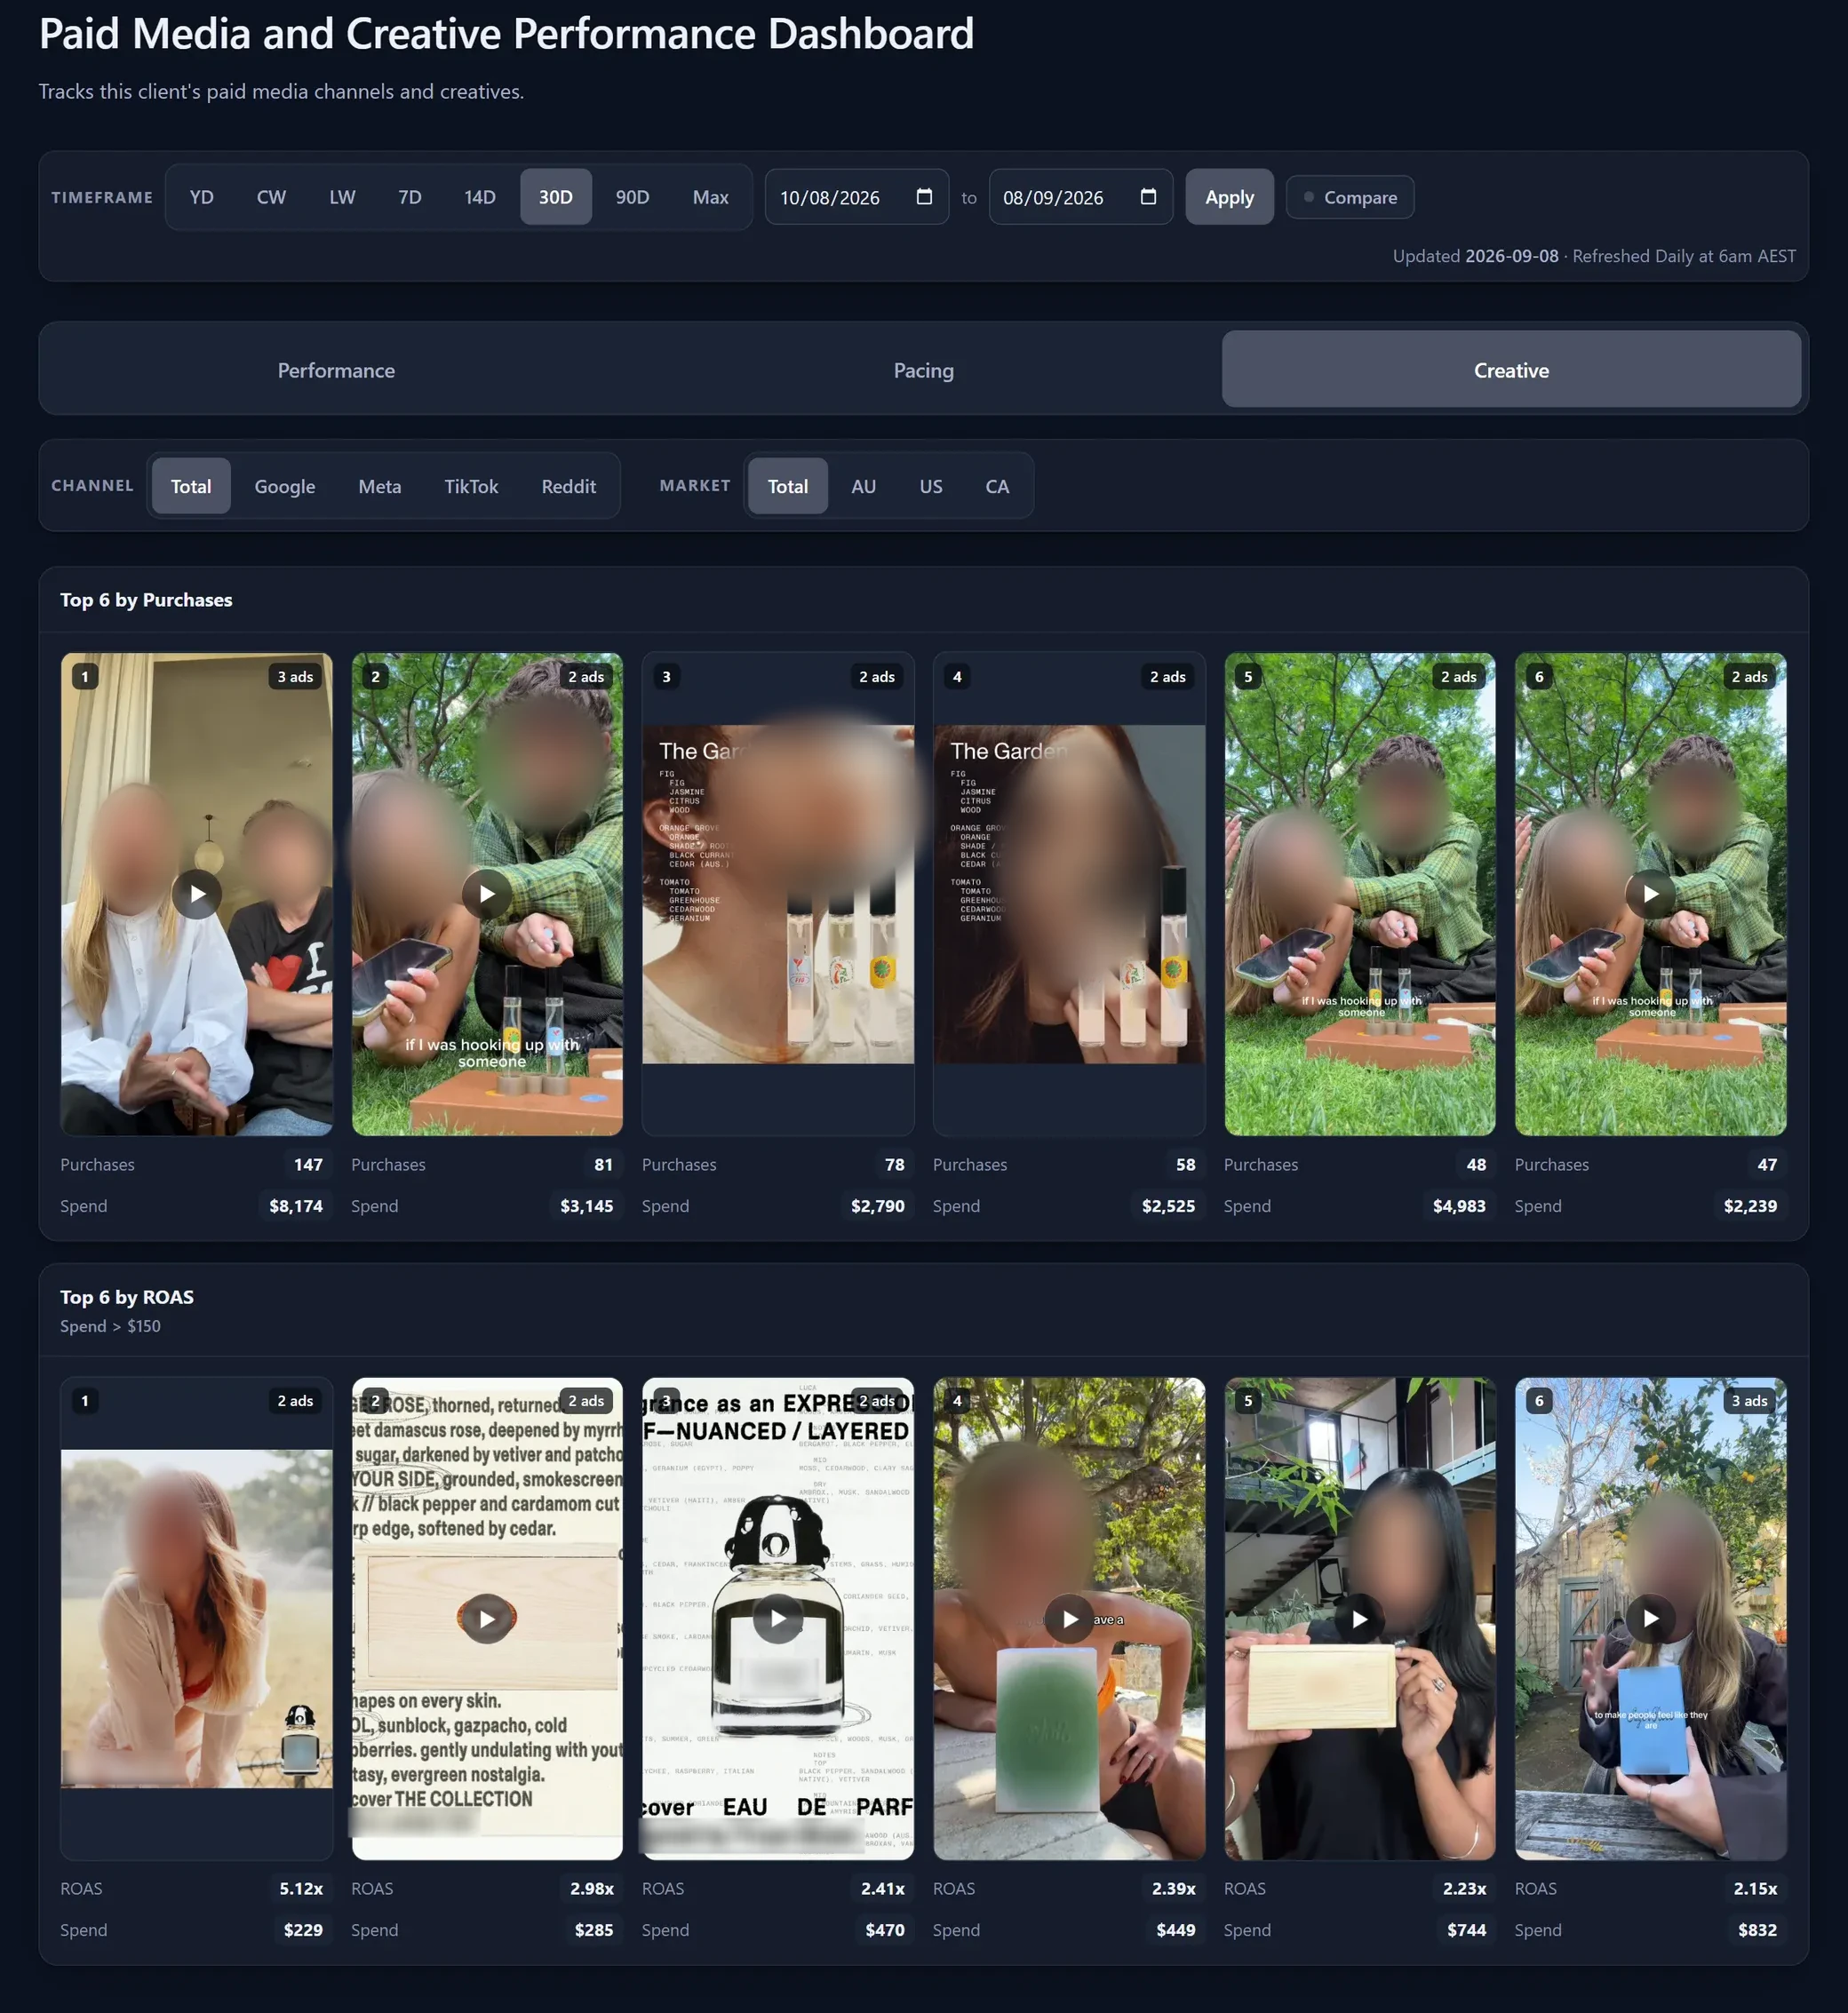
Tap a number to zoom in.
Performance view · Tiles and Performance by Channel
Real creative examples
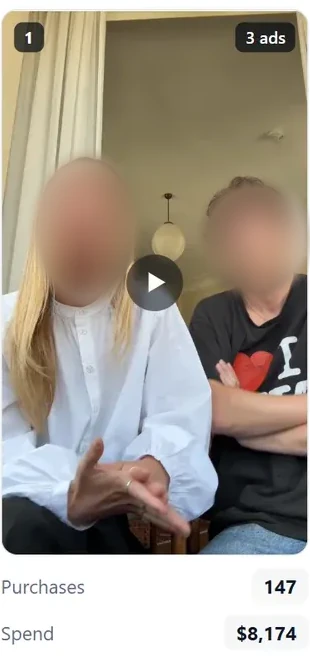
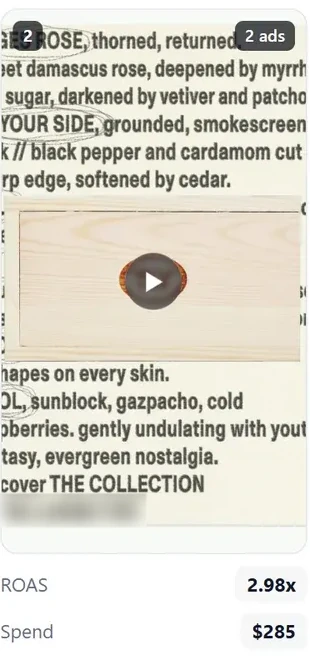
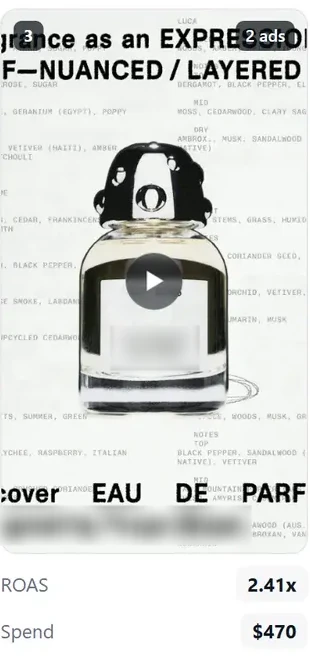
These are real ads from the Creative view, ranked by the dashboard. Look at who wins each board.
Top 6 by Purchases



Top 6 by ROAS, spend over $150

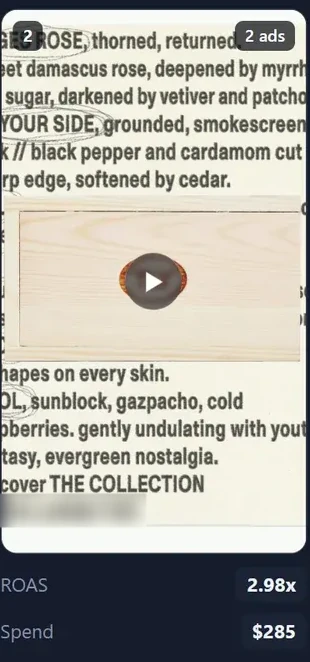
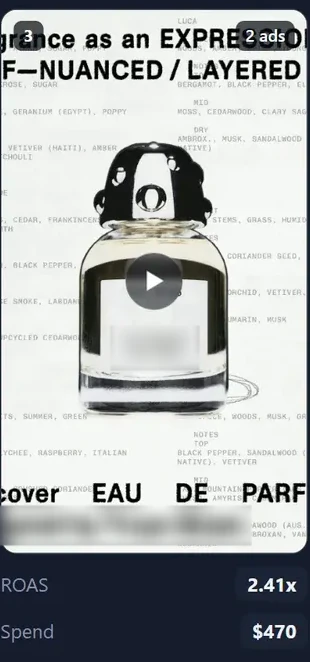
Not one of the six creatives with the most purchases makes the six with the best return. Volume and efficiency are different questions. Your team needs both answers.
What your team can decide
The dashboard does not make the call. It shortens the distance to it.
Start with Top 6 by ROAS. The $150 spend floor keeps small lucky tests off it.
See it on the dashboardTop 6 by Purchases. It shows what each one spent to get there.
See it on the dashboardSpend sits under every creative, and every channel gets its own row in Performance.
See it on the dashboardSwitch the market filter and read the same view again.
See it on the dashboardA creative that is high on purchases but missing from the ROAS board. It is buying volume. Check what that volume costs.
See it on the dashboardStill your team's call
What's inside
The full dashboard, annotated, every control and view explained on the dashboard's own screens.
How to read Performance, the four headline numbers and the channel table, column by column.
How to read Creative, the two boards, the $150 spend floor and creatives that run in several ads.
Real creative examples, what the boards showed, and the questions they raise.
The decisions it supports, six questions your team can answer from one screen.
What sits underneath, four ad platforms, one warehouse and a daily refresh.
A build checklist, what you need in place to build your own version.
What you can download
The Paid Media + Creative Performance Dashboard breakdown
PDFThe dashboard view by view, the metrics in plain words, real creative examples, the decisions it supports and a build checklist.
Get the full breakdown of the dashboard, view by view. It lands in your inbox in a few minutes.
Free. Sent straight to your inbox. No spam, unsubscribe anytime.
Keep exploring the Intelligence Library
Reporting & Dashboards

2026-08-28
Marketing
2026-06-12
Marketing
2026-09-17